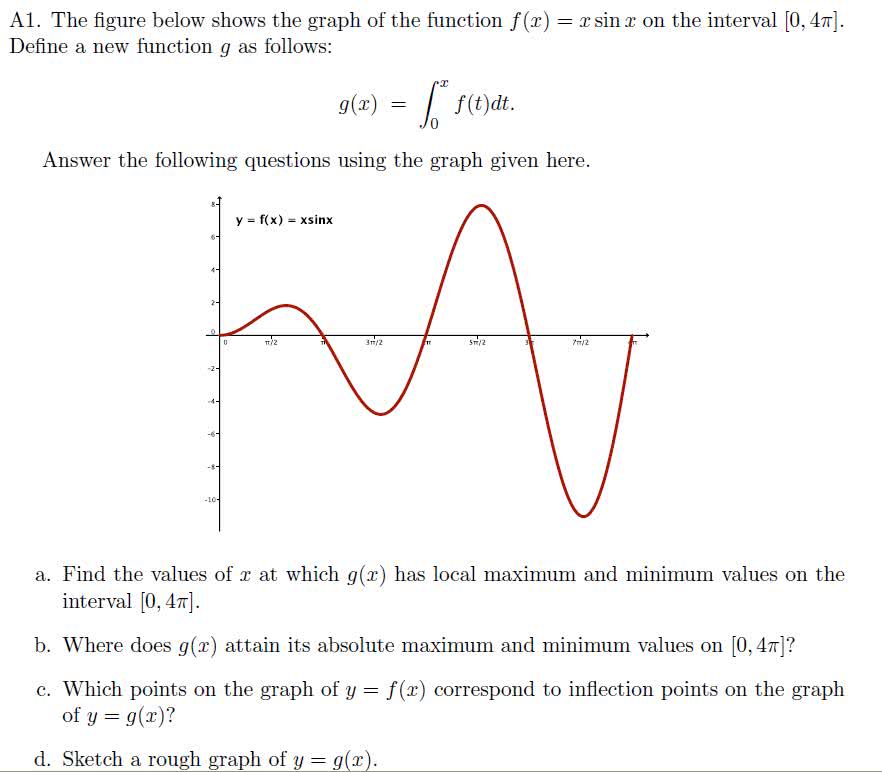
The figure below shows the graph of the function f(x) = x sin x on the interval [0,4 pi ]. Define a new function g as follows: g(x) = f(t)dt. Answer the following questions using the graph given here. Find the values of x at which g(x) has local maximum and minimum values on the interval [0, 4 pi]. Where does g(x) attain its absolute maximum and minimum values on [0,4 pi ]? Which points on the graph of y = f(x) correspond to inflection points on the graph of y = g(x)? Sketch a rough graph of y = g(x).
Show transcribed image textThe figure below shows the graph of the function f(x) = x sin x on the interval [0,4 pi ]. Define a new function g as follows: g(x) = f(t)dt. Answer the following questions using the graph given here. Find the values of x at which g(x) has local maximum and minimum values on the interval [0, 4 pi]. Where does g(x) attain its absolute maximum and minimum values on [0,4 pi ]? Which points on the graph of y = f(x) correspond to inflection points on the graph of y = g(x)? Sketch a rough graph of y = g(x).