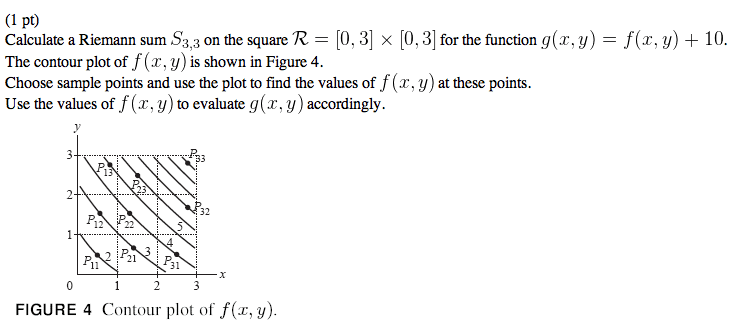
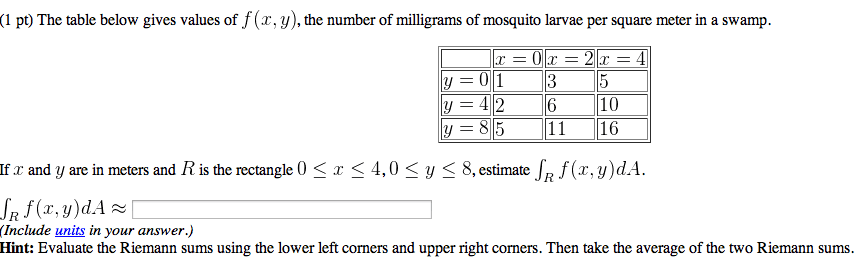
Calculate a Riemann sum S3,3 on the square R = [0,3] times [0, 3] for the function g(x, y) = f(x, y) + 10. The contour plot of f(x, y) is shown in Figure 4. Choose sample points and use the plot to find the values of f(x, y) at these points. Use the values of f(x, y) to evaluate g(x, y) accordingly. FIGURE 4 Contour plot of f(x, y). The table below gives values of f(x, y), the number of milligrams of mosquito larvae per square meter in a swamp. If x and y are in meters and R is the rectangle 0 x 4, 0 y 8, estimate . (Include units in your answer.) Hint: Evaluate the Riemann sums using the lower left corners and upper right corners. Then take the average of the two Riemann sums.
Show transcribed image textCalculate a Riemann sum S3,3 on the square R = [0,3] times [0, 3] for the function g(x, y) = f(x, y) + 10. The contour plot of f(x, y) is shown in Figure 4. Choose sample points and use the plot to find the values of f(x, y) at these points. Use the values of f(x, y) to evaluate g(x, y) accordingly. FIGURE 4 Contour plot of f(x, y). The table below gives values of f(x, y), the number of milligrams of mosquito larvae per square meter in a swamp. If x and y are in meters and R is the rectangle 0 x 4, 0 y 8, estimate . (Include units in your answer.) Hint: Evaluate the Riemann sums using the lower left corners and upper right corners. Then take the average of the two Riemann sums.