1
answer
0
watching
44
views
10 Nov 2019
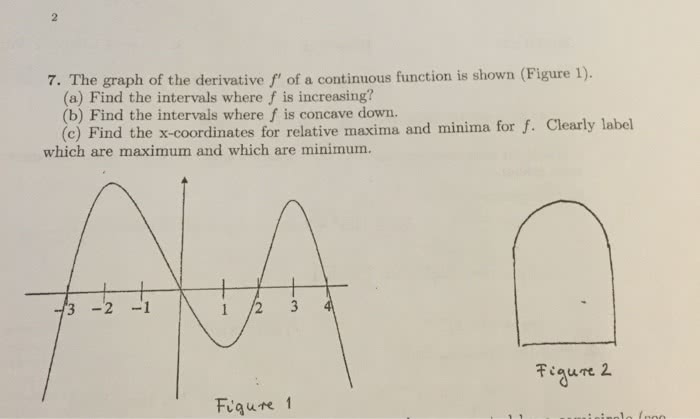
7. The graph of the derivative f? of a continuous function is shown(Figure 1). (a) Find the intervals where f is increasing? (b) Find the intervals where f is concave down. (c) Find the x-coordinates for relative maxima and minima for f. Clearly label which are maximum and which are minimum.
Tod ThielLv2
18 Sep 2019