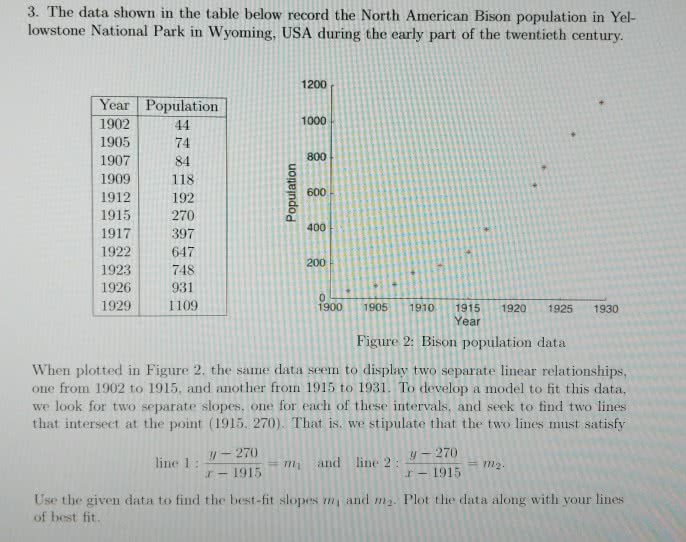
3. The data shown in the table below record the North American Bison population in Yel- lowstone National Park in Wyoming, USA during the early part of the twentieth century 1200 Year Population 190244 1905 74 1907 1909 1912 192 1915 270 1917 397 1922647 1923748 1926 931 1929 1109 1000 800 84 118 600 0 400 200 1900 1905 1910 1915 1920 1925 1930 Year Figure 2: Bison population data When plotted in Figure 2, the same data seem to display two separate linear relationships, one from 1902 to 1915, and another from 1915 to 1931. To develop a model to fit this data, we look for two separate slopes, one for each of these intervals, and seek to find two lines that intersect at the point (1915. 270). That is, we stipulate that the two lines must satisfy line 1: y-2.0= line 2 : y-270 and line 2 r-1915-wi r-1915 = m2. Use the given data to find the best-fit slopes mi and ma. Plot the data along with your lines of best fit.