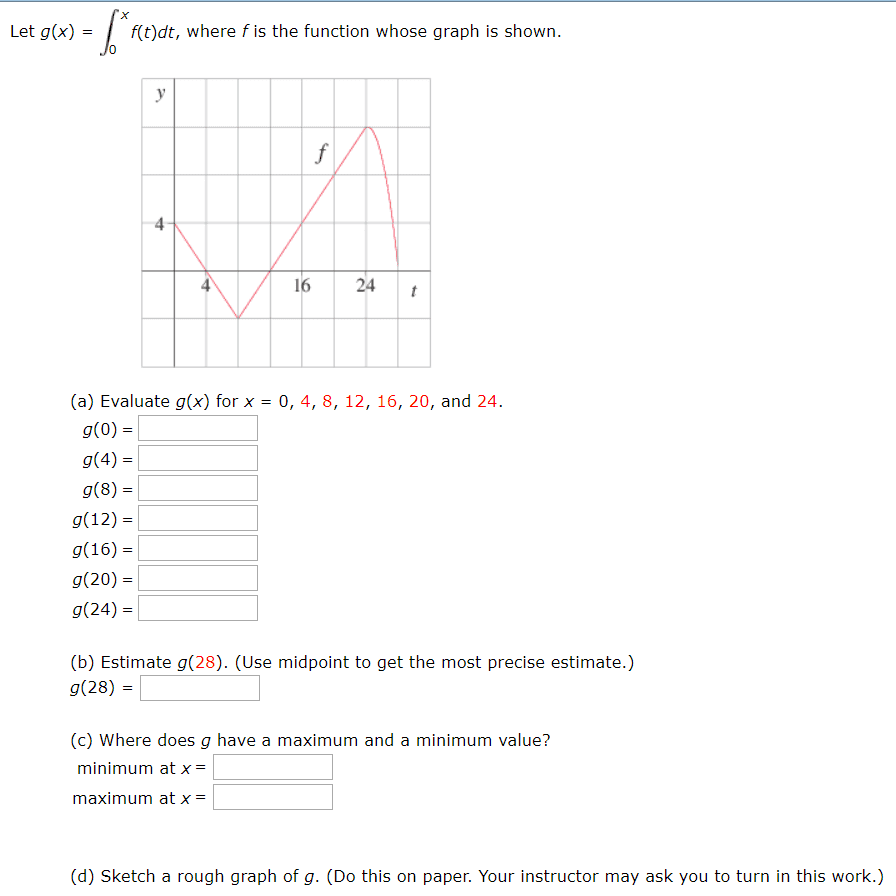
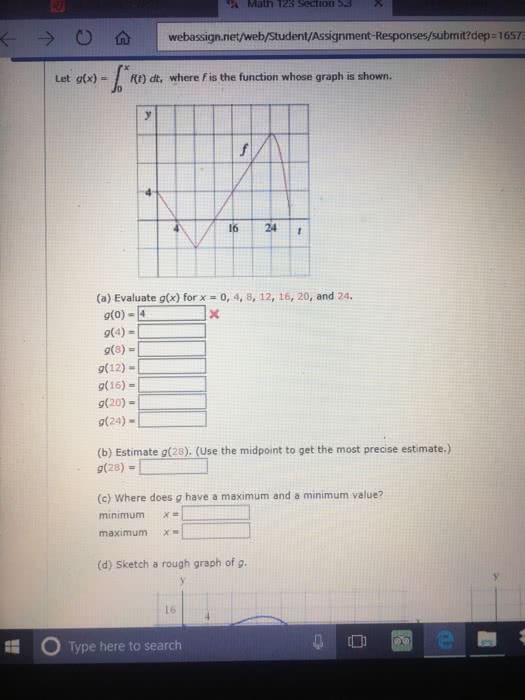
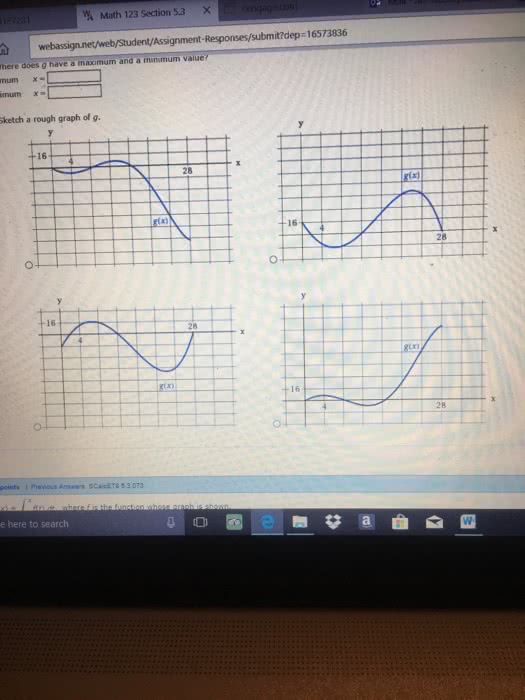
Let g(x) = f(t)dt, where f is the function whose graph is shown 4 16 24 t (a) Evaluate g(x) for x = 0, 4, 8, 12, 16, 20, and 24. g(0) = g(4) = g(8) = g(12) = g(16) = g(20) = g(24) = (b) Estimate g(28). (Use midpoint to get the most precise estimate.) g(28) = (c) Where does g have a maximum and a minimum value? minimum at X= maximum at x= (d) Sketch a rough graph of g. (Do this on paper. Your instructor may ask you to turn in this work.)