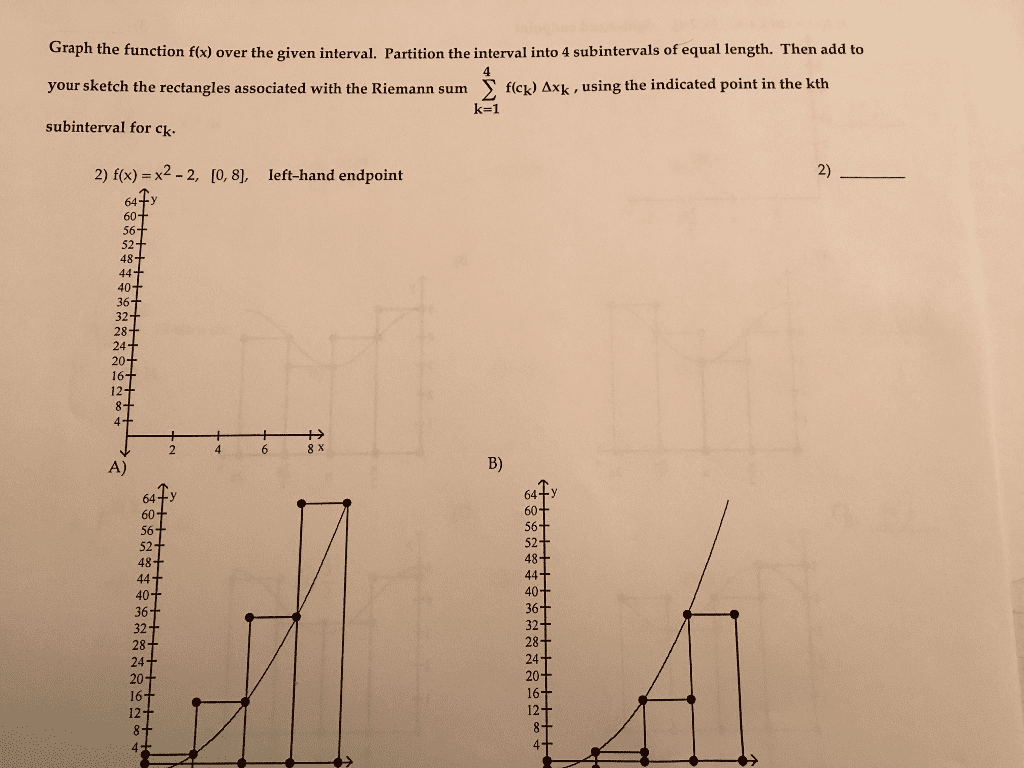
Graph the function f(x) over the given interval. Partition the interval into 4 subintervals of equal length. Then add to your sketch the rectangles associated with the Riemann sum I f(c) Axk, using the indicated point in the kth k=1 subinterval for ck. 2) f(x) = x2 - 2, [0, 8, left-hand endpoint img3%å¦äº f#####å¶ä¸ã w%b284 ww%æ±%f¥西æ±åå¹é bu84 ++++++++++++++++ ç mgæ±ç»å«Wé³äºå¿ å«wbu84 +++++++++