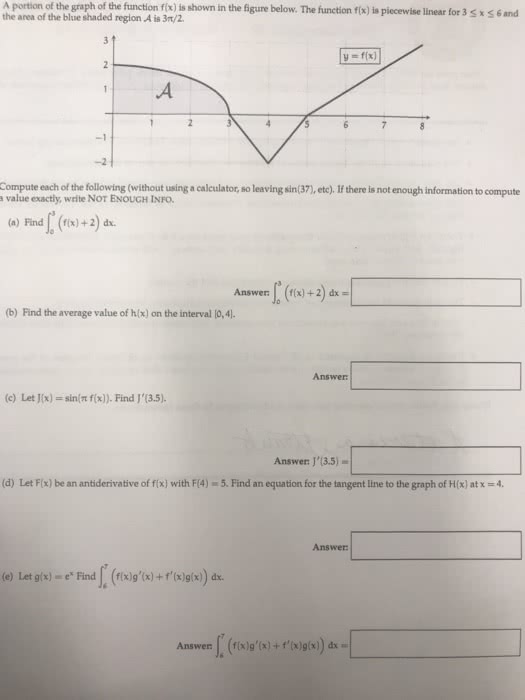
Use the following graph to answer the following 4 questions.
tuby ule velliele during the test. 66.HOW DO YOU SEE IT? The graph of f is shown in the figure. The shaded region A has an area of 1.5, and J6 f (x) dx 3.5. Use this information to fill in the blanks. 2 3 4 5 6 | (a) | f(x) dx (c) lf(x) dx (e) | [2 +f(x)] dx= () The average value of f over the interval [0, 6] is (b) f(x) dx= 0 (d) 1-2/(x) dx = 0 0 0 11:53 AM 11/27/201