Pricing
Log in
Sign up
Home
Homework Help
Study Guides
Class Notes
Textbook Notes
Textbook Solutions
Booster Classes
Blog
Calculus
1
answer
0
watching
92
views
13 Nov 2019
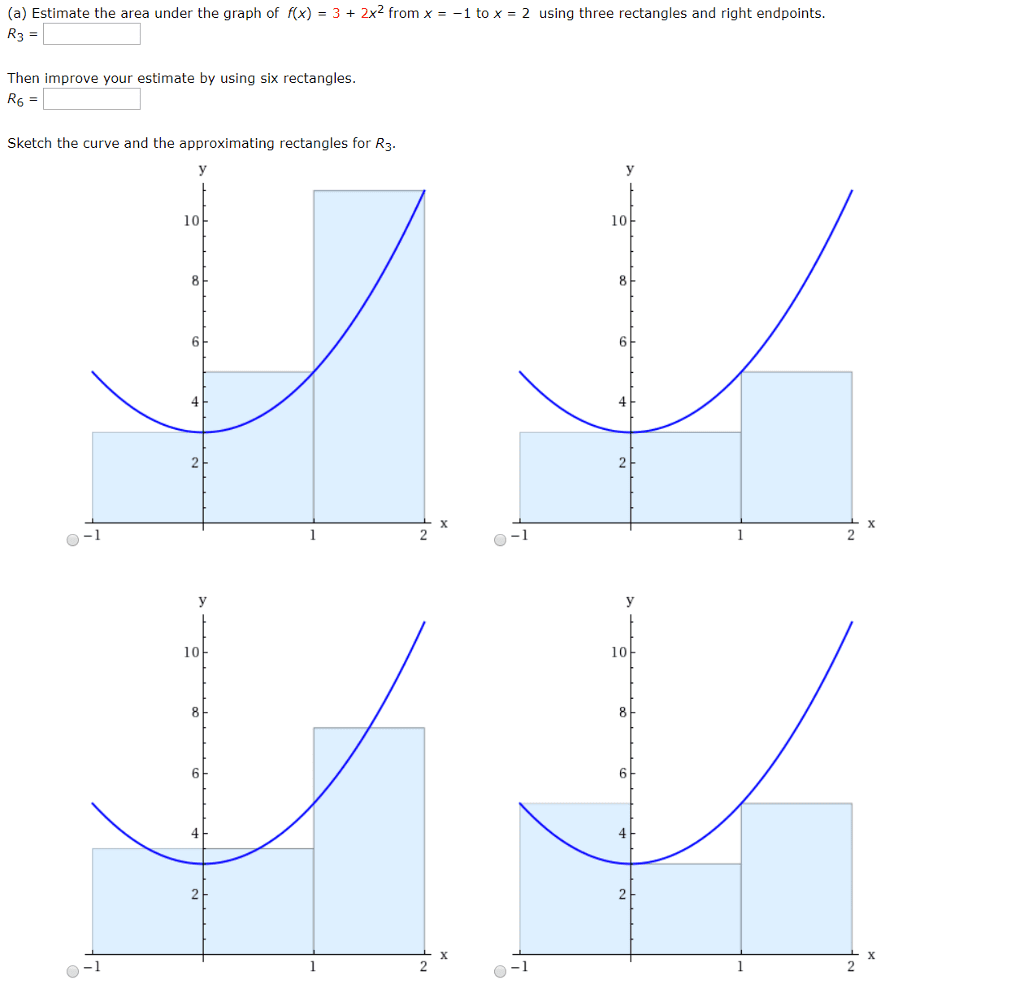
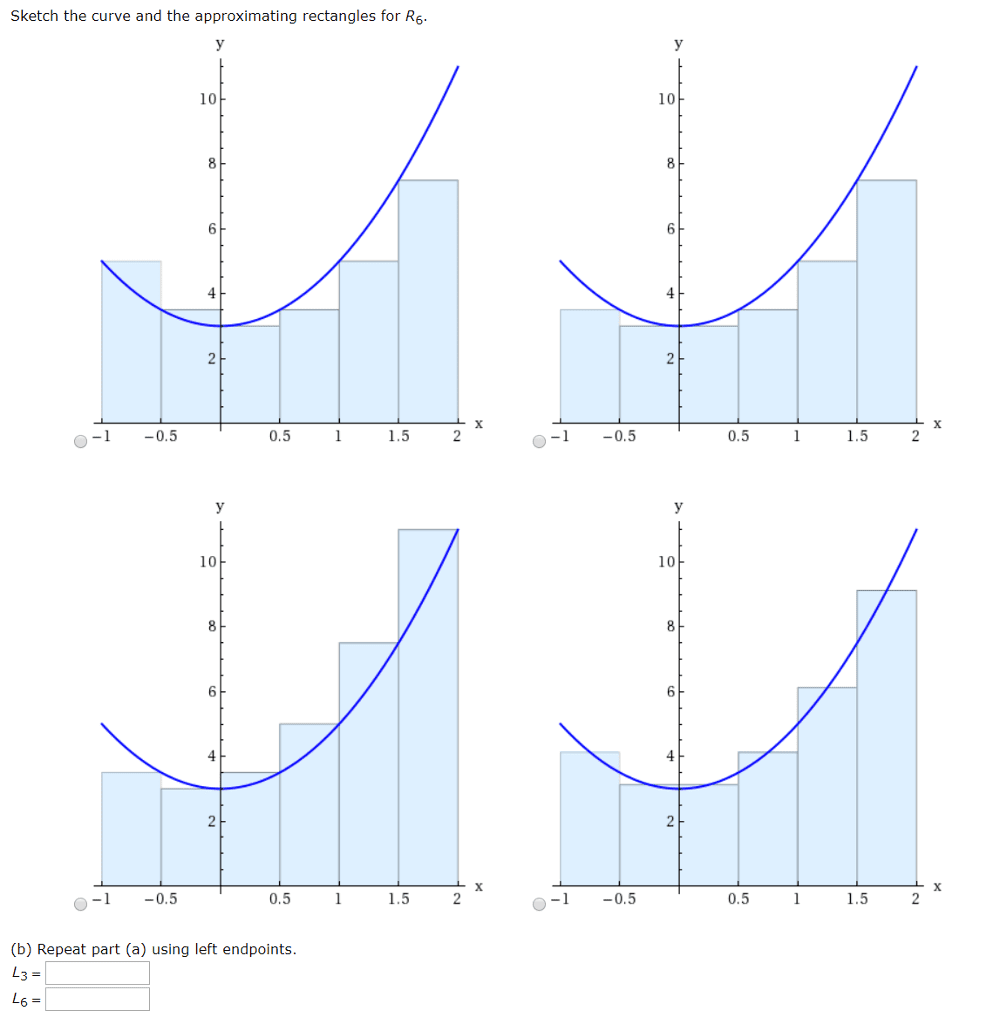
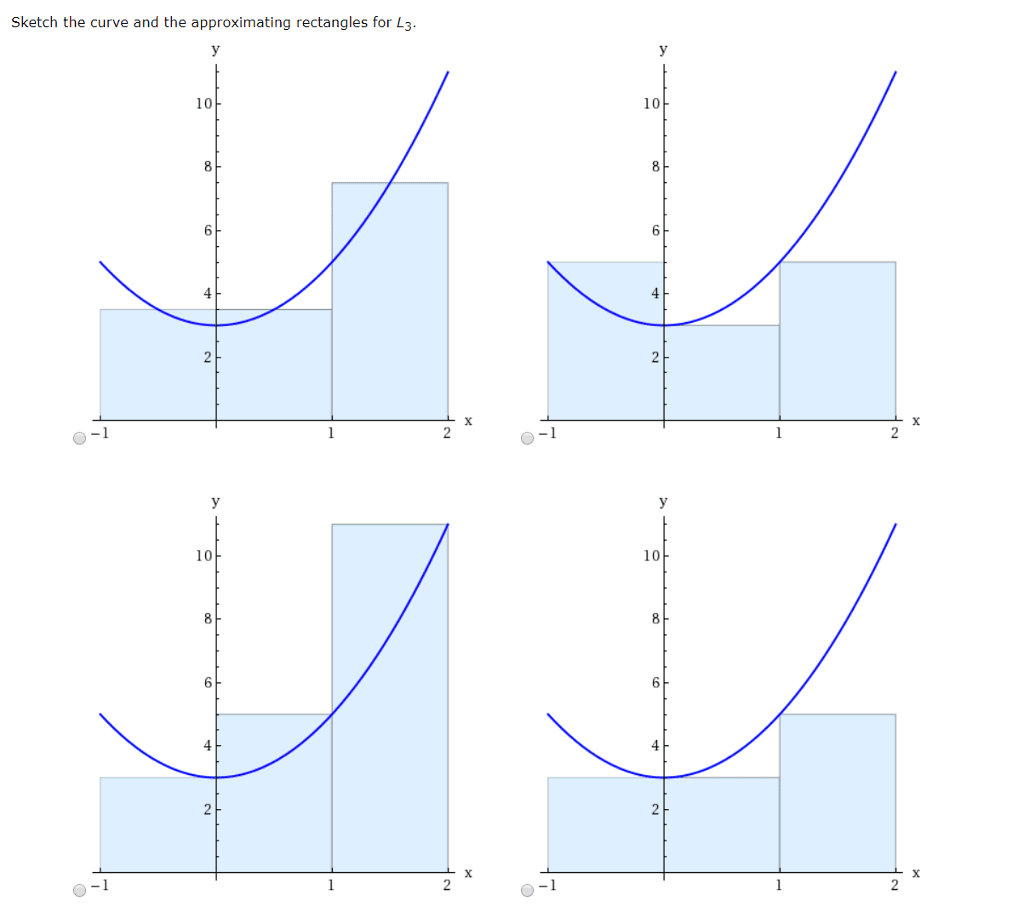
(a) Estimate the area under the graph of fx) 3 2x2 from x-1 to x 2 using three rectangles and right endpoints. Then improve your estimate by using six rectangles. Sketch the curve and the approximating rectangles for R3 10 10 8 6 4 0-1 0-1 10 10 0-1
For unlimited access to Homework Help, a
Homework+
subscription is required.
You have
0
free answers left.
Get unlimited access to
3.8 million
step-by-step answers.
Get unlimited access
Already have an account?
Log in
Nestor Rutherford
Lv2
5 Mar 2019
Unlock all answers
Get
1
free homework help answer.
Unlock
Already have an account?
Log in
Ask a question
Related textbook solutions
Calculus
4 Edition,
Rogawski
ISBN: 9781319050733
Single Variable Calculus: Early Transcendentals
4th Edition, 2018
Stewart
ISBN: 9781337687805
CALCULUS:EARLY TRANSCENDENTALS
4 Edition,
Rogawski
ISBN: 9781319050740
Weekly leaderboard
Home
Homework Help
3,900,000
Calculus
630,000
Start filling in the gaps now
Log in
New to OneClass?
Sign up
Back to top