1
answer
0
watching
125
views
13 Nov 2019
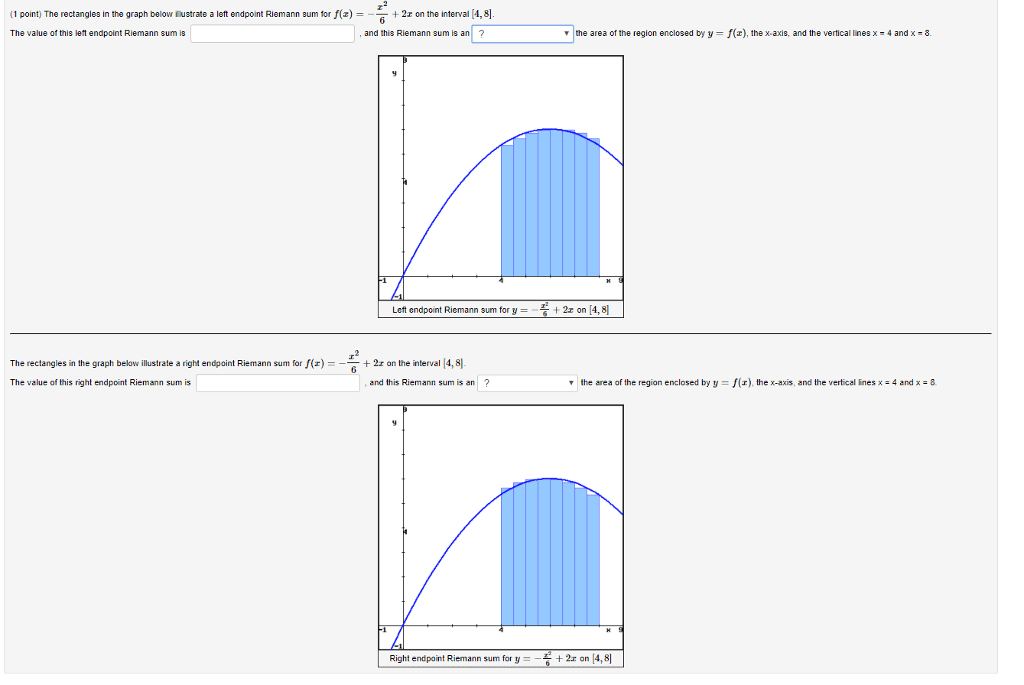
(1 point) The rectangles in the graph below nstrate a left endpoint Riemann sum for f(z) The value of this left endpoint Riemann sum is -6 + 2z on the interval [4,8 -andthi. Riemann sun, an[ ? and this Riemann sum is an? â¼ |the area of the region enclosed by y = f(z), the x-axis, and the vertical lines x = 4 and X-8. Left endpoint Riemann sum for y = +2z on [4,8] The rectangles n the graph below illustrate a right endpoint Riemann sum for /(z) + 21 on the interval 14, 81 The value of this right endpoint Riemann sum is and this Riemann sum is an ? the area of the region enclosed by y = f(z) the x-axis, and the vertical lines x = 4 and x-8 Right endpoint Riemann sum for y = 2x on 14,81
Reid WolffLv2
3 May 2019