Pricing
Log in
Sign up
Home
Homework Help
Study Guides
Class Notes
Textbook Notes
Textbook Solutions
Booster Classes
Blog
Calculus
1
answer
0
watching
110
views
13 Nov 2019
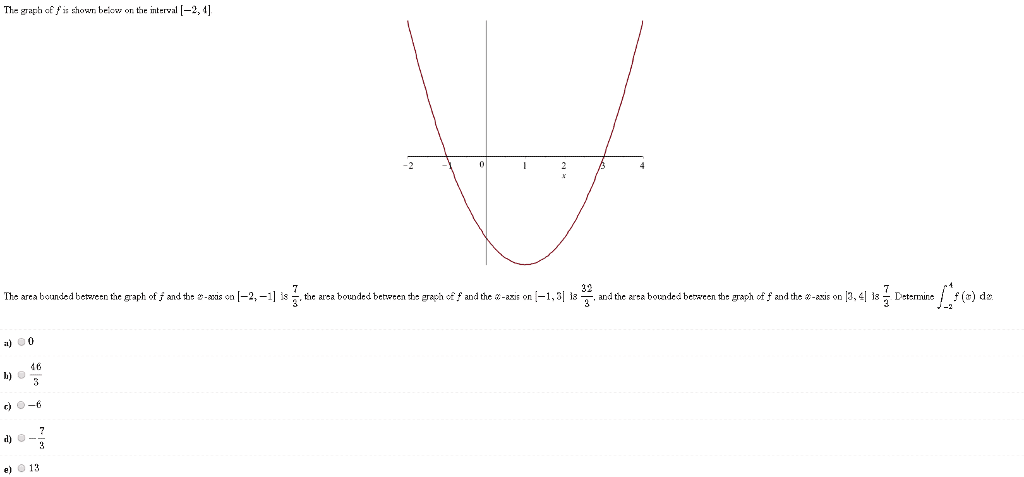
The graph of fis shown below on the interval [-2, 4] The area be de ben een te graphofjan te-a ason 2 te area bo de be re temaer and hea an, on- 3 is 32 is andthearea o de ben eentem h na teo ms SiDe m e i d . ) 0 16 l) c) -6 d) 13
For unlimited access to Homework Help, a
Homework+
subscription is required.
You have
0
free answers left.
Get unlimited access to
3.8 million
step-by-step answers.
Get unlimited access
Already have an account?
Log in
Nestor Rutherford
Lv2
13 Nov 2019
Unlock all answers
Get
1
free homework help answer.
Unlock
Already have an account?
Log in
Ask a question
Related textbook solutions
Calculus
4 Edition,
Rogawski
ISBN: 9781319050733
Single Variable Calculus: Early Transcendentals
4th Edition, 2018
Stewart
ISBN: 9781337687805
CALCULUS:EARLY TRANSCENDENTALS
4 Edition,
Rogawski
ISBN: 9781319050740
Related questions
/www.mathel com/Student/Playerflomework.aspxZhome MATH1160 JMinear Aug18 Sat Homework: Practice HW9 Score: 0 of 1 pt 4.3.5 Find the area under the given curve over the indicated interval yFX2; [2,4] The area under the curve is ( Simplify your answer.)
w.rnatnd.com/Student/playerHomework.aspx?homeworkld=49 MATH 1 1601 Minear-Aug18 Sat Homework: Practice Score: 0 of 1 pt 4.3.9 HW9 Find the area between the curve and the x-axis over the indicated interva y=100-x2 ; [-10, 10] The area under the curve is- (Simplify your answer) Enter your answer in the answer box and then click Check Answer All parts showing
MATH1160 JMinear Aug18 Sat Homework: Practice HW9 Score: 0 of 1 pt 4.3.13 3 o Find the area between the curve and the x-axis over the indicated interval yä¸å¤©: [1.6] The area under the curve is (Type an exact answer.) ul Enter your answer in the answer box and then click Check Answer Clear 2 na find the area above a certain value ed to find area under curve calculator e curves calculator ith steps
Do Homework Charles Kimber-Internet Explorer MATH1160 JMinear Aug18 Sat Homework: Practice HW9 Score: 0 of 1 pt 4.3.15 Charles Kimber& 12/1/18 11 44 of 10 (0 complete) HWScore: 0% 0 Question He Explain what the shaded area represents Te fin minute Choose the correct answer below C A. The total number of pages read in t minutes O B. The total umber of minutes required to read t pages O C. The average pages read per minute in t mnutes O D. The average number of pages read in t minutes Click to select your answer and then chck Check Answer All parts showing ind the area above a certain value d to find area under curve calculator curves calcuiator enovO DOVO F2 FS Fe F12 â Backspace 3 O P Shit
Do Homework- Charles Kimber - Intenet Explorer https://www Student/PlayerHomework.aspx?homeworkld- 4953079958questionld-18 TIII MATH 11 60ãMinear,Aug18,Sat m Homework: Practice HW9 13 Score: 0 of 1 pt 1 8 of 10 (0 complete) Bus Econ 4.3.63 A company estimates that its sales will grow continuously at a rate given by the function so 17e Und where S'(t) is the rate at which sales are increasing, in dollars per day, on day t a) Find the accumulated sales for the first 8 days. b) Find the sales from the 2nd day through the 5th day. (This is the integral from 1 to 5.) ton a) The accumulated sales for the first 8 days is s Cal (Round to the nearest cent as needed.) h.c we ng ne or en e Enter your answer in the answer box and then click Check Answer ti 1 Pemaining Clear A find the area above a certain value ed to find area under curve calculator e curves calculator ve calculator with stepS
ve Do Homework-Charles Kimber- Internet Explorer https//www TII MATH1 160ãMinear Aug18-Sat m Homework: Practice HW9 13 Score: 0 of 1 pt 10 of 4.4.3 Find the area under the graph of f over the interval [-2,3]. s.c Un 2x x>1 The area is. (Simplify your answer.) 5 we ng hel tor etw c.u en te Enter your answer in the answer box and then click Check Answer n/2 rma o find the area above a certain value ted to find area under curve calculator
Show transcribed image text
/www.mathel com/Student/Playerflomework.aspxZhome MATH1160 JMinear Aug18 Sat Homework: Practice HW9 Score: 0 of 1 pt 4.3.5 Find the area under the given curve over the indicated interval yFX2; [2,4] The area under the curve is ( Simplify your answer.)
w.rnatnd.com/Student/playerHomework.aspx?homeworkld=49 MATH 1 1601 Minear-Aug18 Sat Homework: Practice Score: 0 of 1 pt 4.3.9 HW9 Find the area between the curve and the x-axis over the indicated interva y=100-x2 ; [-10, 10] The area under the curve is- (Simplify your answer) Enter your answer in the answer box and then click Check Answer All parts showing
MATH1160 JMinear Aug18 Sat Homework: Practice HW9 Score: 0 of 1 pt 4.3.13 3 o Find the area between the curve and the x-axis over the indicated interval yä¸å¤©: [1.6] The area under the curve is (Type an exact answer.) ul Enter your answer in the answer box and then click Check Answer Clear 2 na find the area above a certain value ed to find area under curve calculator e curves calculator ith steps
Do Homework Charles Kimber-Internet Explorer MATH1160 JMinear Aug18 Sat Homework: Practice HW9 Score: 0 of 1 pt 4.3.15 Charles Kimber& 12/1/18 11 44 of 10 (0 complete) HWScore: 0% 0 Question He Explain what the shaded area represents Te fin minute Choose the correct answer below C A. The total number of pages read in t minutes O B. The total umber of minutes required to read t pages O C. The average pages read per minute in t mnutes O D. The average number of pages read in t minutes Click to select your answer and then chck Check Answer All parts showing ind the area above a certain value d to find area under curve calculator curves calcuiator enovO DOVO F2 FS Fe F12 â Backspace 3 O P Shit
Do Homework- Charles Kimber - Intenet Explorer https://www Student/PlayerHomework.aspx?homeworkld- 4953079958questionld-18 TIII MATH 11 60ãMinear,Aug18,Sat m Homework: Practice HW9 13 Score: 0 of 1 pt 1 8 of 10 (0 complete) Bus Econ 4.3.63 A company estimates that its sales will grow continuously at a rate given by the function so 17e Und where S'(t) is the rate at which sales are increasing, in dollars per day, on day t a) Find the accumulated sales for the first 8 days. b) Find the sales from the 2nd day through the 5th day. (This is the integral from 1 to 5.) ton a) The accumulated sales for the first 8 days is s Cal (Round to the nearest cent as needed.) h.c we ng ne or en e Enter your answer in the answer box and then click Check Answer ti 1 Pemaining Clear A find the area above a certain value ed to find area under curve calculator e curves calculator ve calculator with stepS
ve Do Homework-Charles Kimber- Internet Explorer https//www TII MATH1 160ãMinear Aug18-Sat m Homework: Practice HW9 13 Score: 0 of 1 pt 10 of 4.4.3 Find the area under the graph of f over the interval [-2,3]. s.c Un 2x x>1 The area is. (Simplify your answer.) 5 we ng hel tor etw c.u en te Enter your answer in the answer box and then click Check Answer n/2 rma o find the area above a certain value ted to find area under curve calculator
olivewombat720
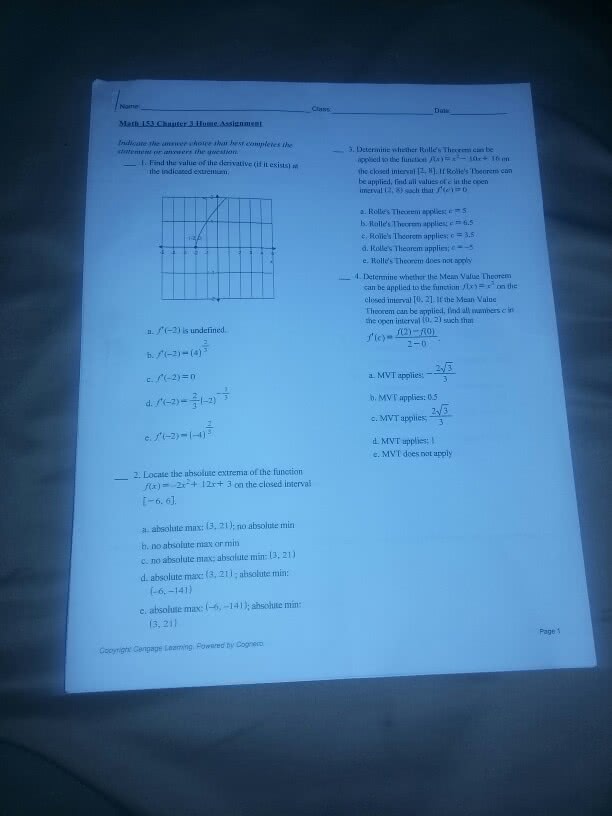
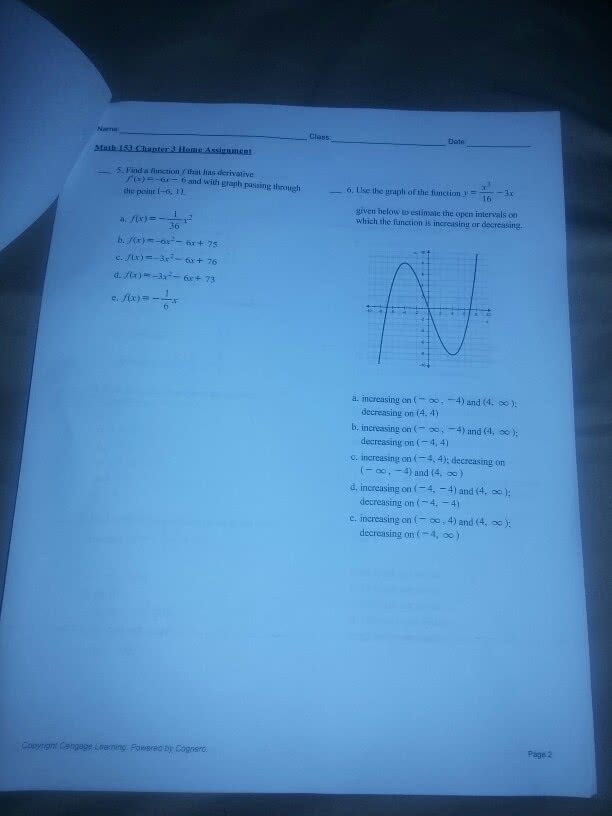
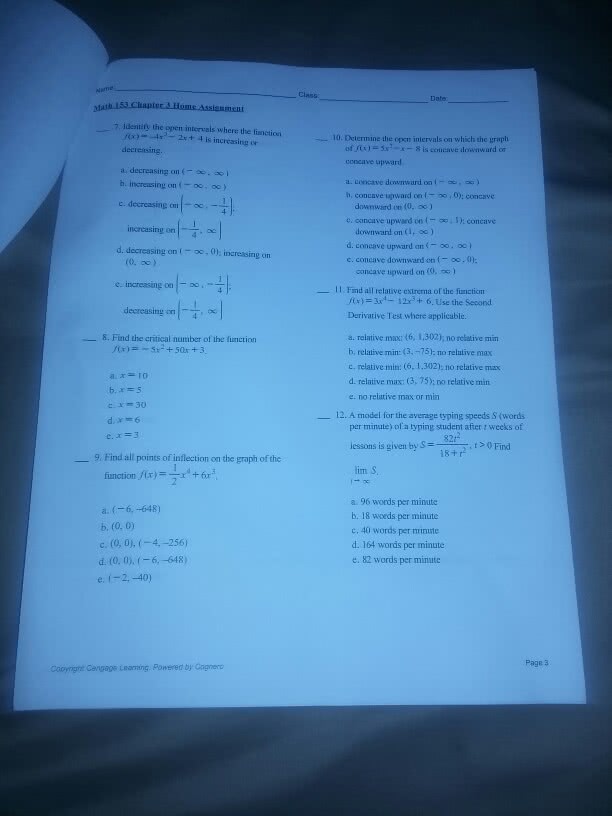
Class Dane Indicate the aeswer choice shar best completes the ã¼3. Determine whelher Rille's minemmen be smemerw or anwers the qmestio agplied to the lunctiin"-?-10r+ 16.m the closed interval 81. If Rolles lheurens can be appliad, lind all values of c in the open innerval (2,8) such that r(c)= D 1. Find ihe value of the denvative (if it exists) ã¼ the indicated extrenum. a. Rolle's Theorem appliese s b. Rolle's Theorem applies: c =65 c, Rolle's Theorem applies: c = 3.5 d. Rolle's Theorem applies; c--5 e. Rolle's Thecrem does not apply 4. Dttermine whether te Mean Value Theorem can be applied to the function fx)= on the closed interval [0, 21.If the Mean Value Thoorem can be applied, find all wambers c in the open interval (0, 2)such that a. /(-2) is undefined. ic) 2,/3 a. MVT applies;- b. MVI applies: 0.5 c. MVT applies3 d. MVT applies; I e. MVT does not apply 2·Locate the absolute extrema of the function fx)2+ 12r+ 3 on the closed interval T-6, 6]. a. absolute max: (3, 21); no absolute min b. no absolute max or min c. no absolute max: absolute min: [3, 21) d. absolute max: (3, 21); ahsolute min: (-6.-141) c, absolute max:(-6,-141); absolute min: (3, 21) Page 1 Cooyright Cengape Loaming Powored by Cogero
This Question: 1 pt 12 of 44 (0 complete) This Quiz: 44 pts possible Verify Property 2 of the definition of a probability density function over the given interval. ffx) 22x What is Property 2 of the definition of a probability density function? O A. The area under the graph of f over the interval [a,bl is b O B. The area under the graph of f over the interval [a.b] is 1 O C. The area under the graph of f over the interval [a,b is a. Since the given interval. [0.oo), has a right-endpoint of infinity, the area under the graph of fwill be calculated using an improper integral. Choose the correct formula for an improper integral over the interval [a,ool below t(x) dx= lim | f(x) dx= lim [F(x)]a= lim (F(b)-F(a)) b-o0 f(x) dx = lim | f(x) dx = lim [F(x)]-lim (F(a)-F(b)) b- 00 b--0o f(x) dk- lim x) dx- lim [F(x)m (F(b)-F(a)) b-+00
O D. 00 f(x) dx= lim f(x) dx= lim [F(棴= lim (F(a)-F(b)) b--oã Substitute a and b into the left side of the formula from the previous step and express the integral as a limit. area 2edx lim2edx Next, determine F(x). First, find the antiderivative of f. 2(Use C as the artbitrary constant.)
Next, determine F(x). First, find the antiderivative of f. as the anbliay cosat) Let C 0 in the expression obtained above and let the resulting expression be F(x). Evaluate the result over [0,oo) using the far right side of the formula for the area. area = As b approaches oo, e approaches infinity where c is a constant. Use this fact to calculate the limits from the previous step area+1 Is Property 2 of the definition of a probability density function over the given interval now verified? Choose the correct answer below A Property 2 o the definition o a probability density unction over the given interval has been ver ed since the expression in the previous step simplifies to o B. Property 2 of the definition of a probability density function over the given interval has not been verified because the expression in the previous step does not simplify to the expected area value. ° C. â D Property 2 ofthe definition of a probability density function over the given interval has been verified since the expression in the previous step simplifies to 0 Property 2 o the definition o a probability density unction over the given interval has been ve ned since the expressio n e evious ste si plifies to 1.
Show transcribed image text
This Question: 1 pt 12 of 44 (0 complete) This Quiz: 44 pts possible Verify Property 2 of the definition of a probability density function over the given interval. ffx) 22x What is Property 2 of the definition of a probability density function? O A. The area under the graph of f over the interval [a,bl is b O B. The area under the graph of f over the interval [a.b] is 1 O C. The area under the graph of f over the interval [a,b is a. Since the given interval. [0.oo), has a right-endpoint of infinity, the area under the graph of fwill be calculated using an improper integral. Choose the correct formula for an improper integral over the interval [a,ool below t(x) dx= lim | f(x) dx= lim [F(x)]a= lim (F(b)-F(a)) b-o0 f(x) dx = lim | f(x) dx = lim [F(x)]-lim (F(a)-F(b)) b- 00 b--0o f(x) dk- lim x) dx- lim [F(x)m (F(b)-F(a)) b-+00
O D. 00 f(x) dx= lim f(x) dx= lim [F(棴= lim (F(a)-F(b)) b--oã Substitute a and b into the left side of the formula from the previous step and express the integral as a limit. area 2edx lim2edx Next, determine F(x). First, find the antiderivative of f. 2(Use C as the artbitrary constant.)
Next, determine F(x). First, find the antiderivative of f. as the anbliay cosat) Let C 0 in the expression obtained above and let the resulting expression be F(x). Evaluate the result over [0,oo) using the far right side of the formula for the area. area = As b approaches oo, e approaches infinity where c is a constant. Use this fact to calculate the limits from the previous step area+1 Is Property 2 of the definition of a probability density function over the given interval now verified? Choose the correct answer below A Property 2 o the definition o a probability density unction over the given interval has been ver ed since the expression in the previous step simplifies to o B. Property 2 of the definition of a probability density function over the given interval has not been verified because the expression in the previous step does not simplify to the expected area value. ° C. â D Property 2 ofthe definition of a probability density function over the given interval has been verified since the expression in the previous step simplifies to 0 Property 2 o the definition o a probability density unction over the given interval has been ve ned since the expressio n e evious ste si plifies to 1.
violetjellyfish535
Weekly leaderboard
Home
Homework Help
3,900,000
Calculus
630,000
Start filling in the gaps now
Log in
New to OneClass?
Sign up
Back to top