The return on investment (ROI) from education is typically the highest for:
(i) An individual with a high school diploma
(ii) An individual with a 4-year Bachelor's Degree
(iii) An individual with a senior high school diploma
(iv) The ROI is equal for each of the levels
The return on investment (ROI) from education is typically the highest for:
(i) An individual with a high school diploma
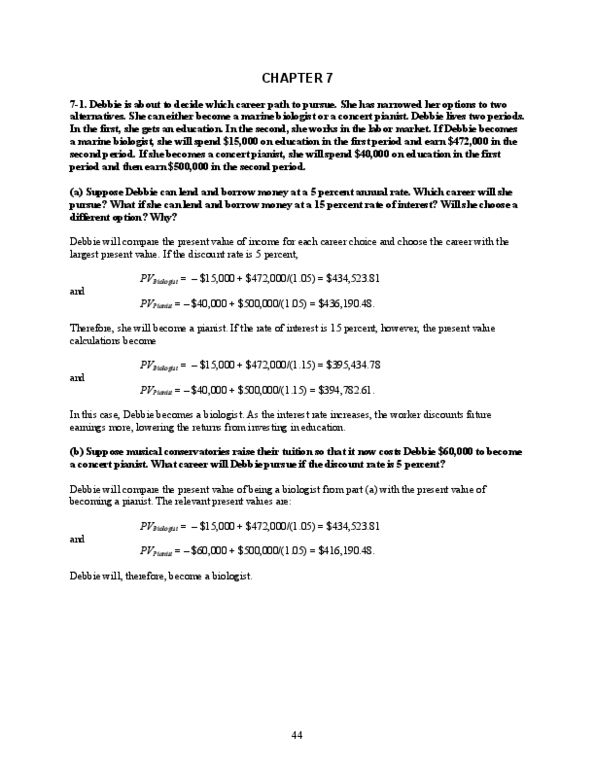
(ii) An individual with a 4-year Bachelor's Degree
(iii) An individual with a senior high school diploma
(iv) The ROI is equal for each of the levels

Related textbook solutions


Related questions
| In a Midwestern state the proportion of the population 21 years of age or older who have a high school diploma is ? = 0.9. | |||||||||
| 6 | For samples of size n = 800 obtained from this population, the standard error of the sample proportion p? is, se(p?) = ______. | ||||||||
| a | 0.0245 | ||||||||
| b | 0.0205 | ||||||||
| c | 0.0122 | ||||||||
| d | 0.0106 | ||||||||
| 7 | The probability that in a sample of n = 800 the sample proportion of individuals with a higher education degree is between 0.88 and 0.92 is, P(0.88 < p? < 0.92) = _____. | ||||||||
| a | 0.9817 | ||||||||
| b | 0.9625 | ||||||||
| c | 0.9412 | ||||||||
| d | 0.9109 | ||||||||
| 8 | The proportion of p? values obtained from samples of size n = 800 that fall within | ||||||||


correlation:
| medInc $ | HS degree % | |
| med inc | 1 | |
| HS degree % | -0.033158666 | 1 |
regression:
| multiple R | .03315867 |
| R Square | .0010995 |
| adjusted r sq | -.0177477 |
| standard error | 6902.6743 |
| observation | 55 |
| df | ss | ms | f | sig. f | |
| regression | 1 | 2779601.33 | 22779601.33 | .05833749 | .81007522 |
| residual | 53 | 2525286360 | 47646912.5 | ||
| total | 54 | 25280659 |
| coefficients | standard error | t stat | p-value | lower 95% | upper 95% | lower 95.0% | upper 95.0% | |
| interpret | 42273.3497 | 13809.7807 | 3.0611665 | .00345814 | 14574.4373 | 69972.2621 | 14574.4373 | 69972.2621 |
| hs degree | -49.414226 | 204.587042 | -.2415316 | .81007522 | -459.76387 | 360.935414 | -459.76386 | 360.935414 |
a. very briefly interpret the estimated correlation coefficient...the direction and strength of the correlation
b. List and label the dependent variable and independent variable
c. based on regression results if a country's percentage of the population with at least a high school diploma increases by 1 by how much and in one direction does a country's median income change?
d. what is the predicted medinc for an HS degree of 70%
e. what proportion of the variation in medinc is explained by our regression model explained by variation in HS degree?