2
answers
0
watching
121
views
23 Mar 2018
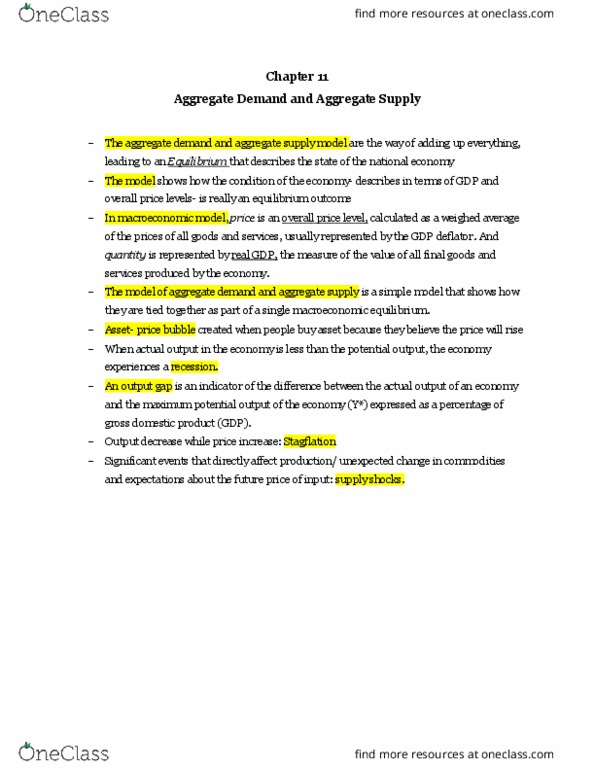
Le the figure below to swer the following questions. Price level (GDP deflator, 2002-100 SAS 0 320 360 400 440 480 520 Real GDP billions of 2002 dollars Figure 26.3.1 3) Refer to Figure 26.3.1. Econoworld is at its short-run macroeconomic equilibrium. There is a difference between_ _real GDP and potential GDP of $__ billion A) above full-employment equilibrium; 20 B) below full-employment equilibrium; 40 below full-employment equilibrium; 20 D) above full-employment equilibrium; 40 E) full-employment equilibrium; O
Le the figure below to swer the following questions. Price level (GDP deflator, 2002-100 SAS 0 320 360 400 440 480 520 Real GDP billions of 2002 dollars Figure 26.3.1 3) Refer to Figure 26.3.1. Econoworld is at its short-run macroeconomic equilibrium. There is a difference between_ _real GDP and potential GDP of $__ billion A) above full-employment equilibrium; 20 B) below full-employment equilibrium; 40 below full-employment equilibrium; 20 D) above full-employment equilibrium; 40 E) full-employment equilibrium; O


Collen VonLv2
26 Mar 2018
Already have an account? Log in