1. ExpIain with the heIp of graphs h0w a flrm mlnlmlzes costs in the long run
2. Draw a graph 0f a market for a flrm ln a perfectIy competltive lndustry. lndicate the short run profit maximizing quantity and the profits for the firm. Explain with equations.
3a) ExpIain what the deadwelght Ioss of a non-discriminating monopoIy is with words and graphs.
B) Why is the Iong run equilibrium under perfect competition more effecient than monopoIy?
4)
Quantity
Fixed
Cost
Variable
Cost
Total
Cost
Marginal
Cost
Average
Fixed
Cost
Average
Variable
Cost
Average
Total
Cost
0
$30
$0
$30
0
0
0
0
1
$30
$30
$60
30
30
30
69
2
$30
$48
$78
18
15
24
39
3
$30
$57
$87
9
10
19
29
4
$30
$64
$94
7
7.5
16
23.5
5
$30
$85
$115
21
6
17
23
A) At what point will the MarginaI Cost Curve lntersect the ATC?
B) At what point will the MarginaI Cost Curve lntersect the AVC?
1. ExpIain with the heIp of graphs h0w a flrm mlnlmlzes costs in the long run
2. Draw a graph 0f a market for a flrm ln a perfectIy competltive lndustry. lndicate the short run profit maximizing quantity and the profits for the firm. Explain with equations.
3a) ExpIain what the deadwelght Ioss of a non-discriminating monopoIy is with words and graphs.
B) Why is the Iong run equilibrium under perfect competition more effecient than monopoIy?
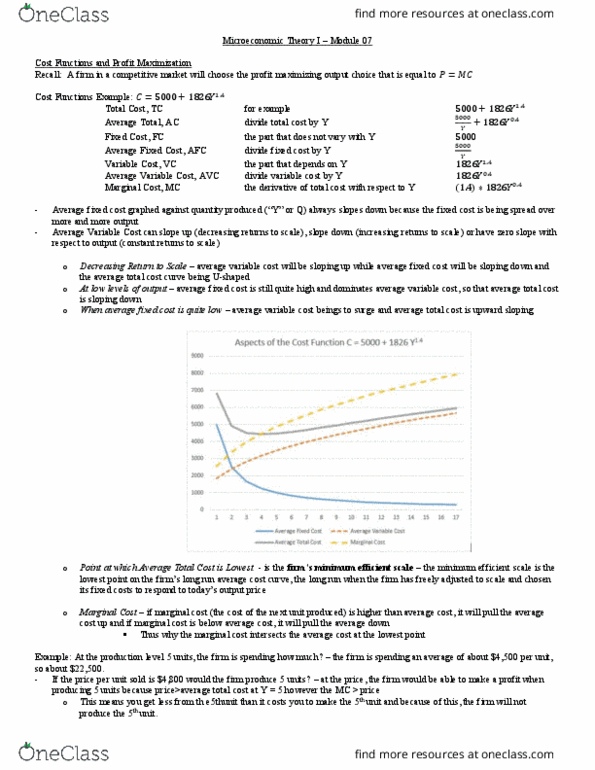
4)
| Quantity | Fixed Cost | Variable Cost | Total Cost | Marginal Cost | Average Fixed Cost | Average Variable Cost | Average Total Cost |
| 0 | $30 | $0 | $30 | 0 | 0 | 0 | 0 |
| 1 | $30 | $30 | $60 | 30 | 30 | 30 | 69 |
| 2 | $30 | $48 | $78 | 18 | 15 | 24 | 39 |
| 3 | $30 | $57 | $87 | 9 | 10 | 19 | 29 |
| 4 | $30 | $64 | $94 | 7 | 7.5 | 16 | 23.5 |
| 5 | $30 | $85 | $115 | 21 | 6 | 17 | 23 |
A) At what point will the MarginaI Cost Curve lntersect the ATC?
B) At what point will the MarginaI Cost Curve lntersect the AVC?