1
answer
0
watching
64
views
25 Aug 2018
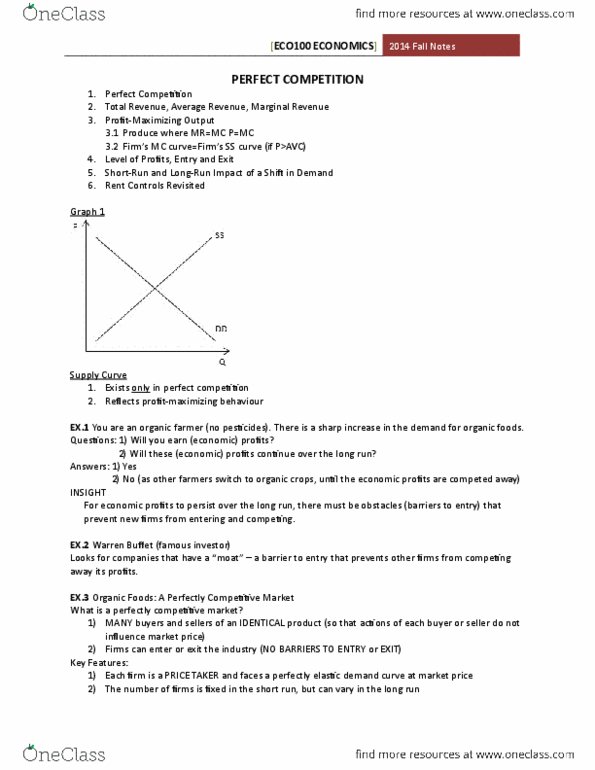
5. (18 points) The figure below shows the cost curves of Kamala's coffee firm in a perfectly competitive market. Use the graph to answer the following questions. a. (2 points) Identify the MC, AC and AVC curves on the graph. b. (5 points) If the price of coffee per pound is $12, then she sells _thousand pounds of coffee. Identify and label the area on the graph that represents her profit or loss. C. (5 points) If the price of coffee is $4/pound, she sells thousand pounds of coffee. Her profit is $ thousand d. (2 points) Identify the short run supply curve of the firm on the graph. e. (10 points) Now assume that the MC and AC curves on the graph represent long run cost curves (ignore the AVC curve). In the long run, the equilibrium price of coffee is $ _pound, quantity sold is thousand pounds and her profit is $ thousand f. (4 points) Briefly explain why a perfectly competitive firm earns zero economic profit in the long run- Price and costs (in $) UNNITT 2 4 6 8 10 12 14 Output (thousand pounds) 16 18 20
5. (18 points) The figure below shows the cost curves of Kamala's coffee firm in a perfectly competitive market. Use the graph to answer the following questions. a. (2 points) Identify the MC, AC and AVC curves on the graph. b. (5 points) If the price of coffee per pound is $12, then she sells _thousand pounds of coffee. Identify and label the area on the graph that represents her profit or loss. C. (5 points) If the price of coffee is $4/pound, she sells thousand pounds of coffee. Her profit is $ thousand d. (2 points) Identify the short run supply curve of the firm on the graph. e. (10 points) Now assume that the MC and AC curves on the graph represent long run cost curves (ignore the AVC curve). In the long run, the equilibrium price of coffee is $ _pound, quantity sold is thousand pounds and her profit is $ thousand f. (4 points) Briefly explain why a perfectly competitive firm earns zero economic profit in the long run- Price and costs (in $) UNNITT 2 4 6 8 10 12 14 Output (thousand pounds) 16 18 20

Reid WolffLv2
25 Aug 2018