#1)
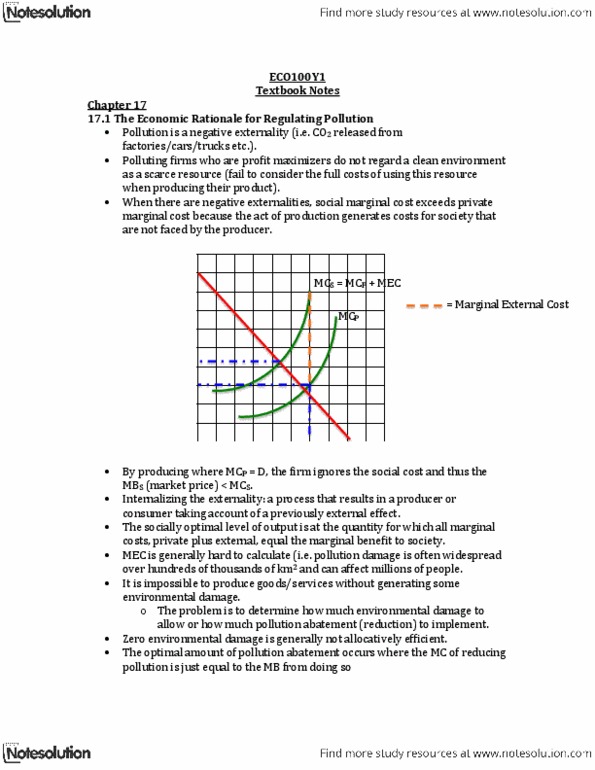
The graph below shows the marginal social benefit and marginal social cost of pollution.
A) Imagine a place like La Grande with relatively clean air. If a new regulation called for everyone to drive electric cars in order to reduce pollution, is that more likely to result in a quantity of pollution like Q1 or Q3? Please explain.
B) Would the dollar amount of the Pigovian tax necessary to make this market operate efficiently be $10, $40, $50, $60, or $100?
#2)
The graphs below show the MB of pollution curves for two firms.
A. In the absence of government intervention, how much would each of these firms pollute?
B. If firm 1 and firm 2 were each given 100 tradable permits to emit pollution (each permit allowing one unit of pollution), what would the resulting amount of pollution reduction be for both firms together? In other words, the reduction from firm 1 plus the reduction from firm 2.
C. If these firms faced a tax on pollution equal to $50 per unit of pollution, which firm would reduce pollution the most?
#3)
The graph below depicts the challenge of managing a common property resource. Based on this graph what is the efficient (optimal) price and quantity?
#4)
Why isn't the optimal level of pollution zero and what is the optimal level of pollution?
GRAPHS-SEE IMAGE LINKS BELOW
#1) http://imgur.com/Aj4xvuy
#2) http://imgur.com/wLsdOJj
#3) http://imgur.com/gthFTOC
#1)
The graph below shows the marginal social benefit and marginal social cost of pollution.
A) Imagine a place like La Grande with relatively clean air. If a new regulation called for everyone to drive electric cars in order to reduce pollution, is that more likely to result in a quantity of pollution like Q1 or Q3? Please explain.
B) Would the dollar amount of the Pigovian tax necessary to make this market operate efficiently be $10, $40, $50, $60, or $100?
#2)
The graphs below show the MB of pollution curves for two firms.
A. In the absence of government intervention, how much would each of these firms pollute?
B. If firm 1 and firm 2 were each given 100 tradable permits to emit pollution (each permit allowing one unit of pollution), what would the resulting amount of pollution reduction be for both firms together? In other words, the reduction from firm 1 plus the reduction from firm 2.
C. If these firms faced a tax on pollution equal to $50 per unit of pollution, which firm would reduce pollution the most?
#3)
The graph below depicts the challenge of managing a common property resource. Based on this graph what is the efficient (optimal) price and quantity?
#4)
Why isn't the optimal level of pollution zero and what is the optimal level of pollution?
GRAPHS-SEE IMAGE LINKS BELOW
#1) http://imgur.com/Aj4xvuy
#2) http://imgur.com/wLsdOJj
#3) http://imgur.com/gthFTOC