firm in the third year of depreciating its onlyâ asset, which originally cost
$ 185 comma 000$185,000
and has aâ 5-year MACRS recovery period
LOADING...
â,
has gathered the following data relative to the currentâ year's operations:
Accruals
$ 14 comma 200$14,200
Current assets
123 comma 000123,000
Interest expense
14 comma 10014,100
Sales revenue
406 comma 000406,000
Inventory
70 comma 60070,600
Total costs beforeâ depreciation, interest and taxes
290 comma 000290,000
Tax rate on ordinary income
40 %40%
a. Use the relevant data to determine the operating cash flow for the current year.
b. Explain the impact thatâ depreciation, as well as any other noncashâ charges, has on aâ firm's cash flows.
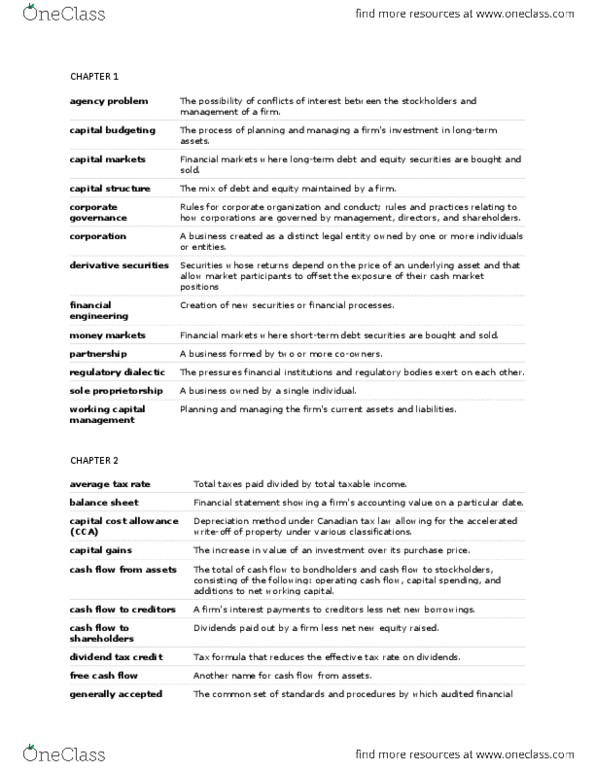
Rounded Depreciation Percentages by Recovery Year Using MACRS for
First Four Property Classes Percentage by recovery year* Recovery year 3 years 5 years 7 years 10 years 1 33% 20% 14% 10% 2 45% 32% 25% 18% 3 15% 19% 18% 14% 4 7% 12% 12% 12% 5 12% 9% 9% 6 5% 9% 8% 7 9% 7% 8 4% 6% 9 6% 10 6% 11 4% Totals 100% 100% 100% 100% Operating Cash Flow Sales revenue $ Less: Total costs before depreciation, interest, and taxes
Depreciation expense Earnings before interest and taxes $ Less: Taxes at 40% Net operating profit after taxes (NOPAT) $ Plus: Depreciation Operating Cash Flow (OCF) $
firm in the third year of depreciating its onlyâ asset, which originally cost
$ 185 comma 000$185,000
and has aâ 5-year MACRS recovery period
LOADING...
â,
has gathered the following data relative to the currentâ year's operations:
| Accruals | $ 14 comma 200$14,200 |
| Current assets | 123 comma 000123,000 |
| Interest expense | 14 comma 10014,100 |
| Sales revenue | 406 comma 000406,000 |
| Inventory | 70 comma 60070,600 |
| Total costs beforeâ depreciation, interest and taxes | 290 comma 000290,000 |
| Tax rate on ordinary income | 40 %40% |
a. Use the relevant data to determine the operating cash flow for the current year.
b. Explain the impact thatâ depreciation, as well as any other noncashâ charges, has on aâ firm's cash flows.
| Rounded Depreciation Percentages by Recovery Year Using MACRS for First Four Property Classes | ||||||||||||||||||||||
| Percentage by recovery year* | ||||||||||||||||||||||
| Recovery year | 3 years | 5 years | 7 years | 10 years | ||||||||||||||||||
| 1 | 33% | 20% | 14% | 10% | ||||||||||||||||||
| 2 | 45% | 32% | 25% | 18% | ||||||||||||||||||
| 3 | 15% | 19% | 18% | 14% | ||||||||||||||||||
| 4 | 7% | 12% | 12% | 12% | ||||||||||||||||||
| 5 | 12% | 9% | 9% | |||||||||||||||||||
| 6 | 5% | 9% | 8% | |||||||||||||||||||
| 7 | 9% | 7% | ||||||||||||||||||||
| 8 | 4% | 6% | ||||||||||||||||||||
| 9 | 6% | |||||||||||||||||||||
| 10 | 6% | |||||||||||||||||||||
| 11 | 4% | |||||||||||||||||||||
| Totals | 100% | 100% | 100% | 100% | ||||||||||||||||||
| |

Related questions
A firm is evaluating the acquisition of an asset that costs $61,200 and requires $3,570 in installation costs. If the firm depreciates the asset underâ MACRS, using aâ 5-year recovery periodâ
determine the depreciation charge for each year.
| Rounded Depreciation Percentages by Recovery Year Using MACRS for | ||||
| First Four Property Classes | ||||
| Percentage by recovery year* | ||||
| Recovery year | 3 years | 5 years | 7 years | 10 years |
| 1 | 33% | 20% | 14% | 10% |
| 2 | 45% | 32% | 25% | 18% |
| 3 | 15% | 19% | 18% | 14% |
| 4 | 7% | 12% | 12% | 12% |
| 5 | 12% | 9% | 9% | |
| 6 | 5% | 9% | 8% | |
| 7 | 9% | 7% | ||
| 8 | 4% | 6% | ||
| 9 | 6% | |||
| 10 | 6% | |||
| 11 | 4% | |||
| Totals | 100% | 100% | 100% | 100% |

âTroy Industries purchased a new machine 5 âyear(s) ago for $78,000.
It is being depreciated under MACRS with aâ 5-year recovery period using the schedule
. Assume 40% ordinary and capital gains tax rates.
a. What is the book value of theâ machine?
b. Calculate theâ firm's tax liability if it sold the machine for each of the followingâ amounts:
$93,600â;
$54,600â;
$3,900â;
and
$2,700.
| Rounded Depreciation Percentages by Recovery Year Using MACRS for | |||||
| First Four Property Classes | |||||
| Percentage by recovery year* | |||||
| Recovery year | 3 years | 5 years | 7 years | 10 years | |
| 1 | 33% | 20% | 14% | 10% | |
| 2 | 45% | 32% | 25% | 18% | |
| 3 | 15% | 19% | 18% | 14% | |
| 4 | 7% | 12% | 12% | 12% | |
| 5 | 12% | 9% | 9% | ||
| 6 | 5% | 9% | 8% | ||
| 7 | 9% | 7% | |||
| 8 | 4% | 6% | |||
| 9 | 6% | ||||
| 10 | 6% | ||||
| 11 | 4% | ||||
| Totals | 100% | 100% | 100% | 100% | |