1
answer
0
watching
202
views

browngoat36Lv1
11 Dec 2019
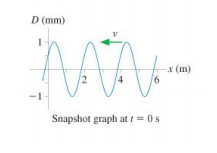
Figure is a snapshot graph of a wave at t = 0 s.

What is the history graph for this wave at x=6 m, for t=0s to 6s?

Figure is a snapshot graph of a wave at t = 0 s.

What is the history graph for this wave at x=6 m, for t=0s to 6s?


SumantLv10
11 Jan 2021