1
answer
0
watching
131
views

11 Dec 2019
The figure shows a graph of the output from an AC voltage source.
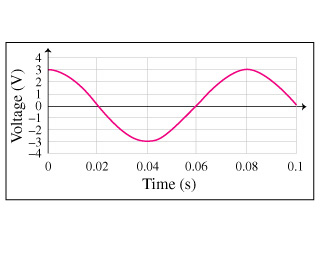
What is the maximum voltage Vmax of the source?
What is the average voltage Vavg of the source?
What is the root-mean-square voltage Vrms of the source?
Express your answer to three significant figures.
What is the period T of the source?
Express your answer in seconds to two significant figures.
What is the frequency f of the source?
Express your answer in hertz to three significant figures.
What is the angular frequency ω of the source?
Express your answer in radians per second to three significant figures.
The figure shows a graph of the output from an AC voltage source.
What is the maximum voltage Vmax of the source?
What is the average voltage Vavg of the source?
What is the root-mean-square voltage Vrms of the source?
Express your answer to three significant figures.
What is the period T of the source?
Express your answer in seconds to two significant figures.
What is the frequency f of the source?
Express your answer in hertz to three significant figures.
What is the angular frequency ω of the source?
Express your answer in radians per second to three significant figures.

Tauseef ShaikhLv10
26 Mar 2021


