1
answer
0
watching
179
views

blueworm505Lv1
6 Oct 2020
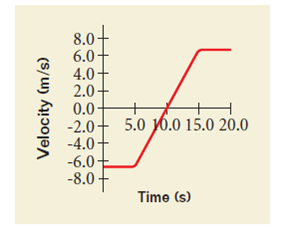
The velocity vs. time graph for an object moving along a straight path is shown in Figure P2.21.
(i) Find the average acceleration of the object during the time interval
(a) 0 to 5.0 s,
(b) 5.0 s to 15 s., and
(c) 0 to 20 s.
(ii) Find the instantaneous acceleration at (a) 2.0 s, (b) 10 s, and (c) 18 s.


Aerielle Anne BeltranLv10
15 Dec 2020