1
answer
0
watching
808
views

6 Oct 2020
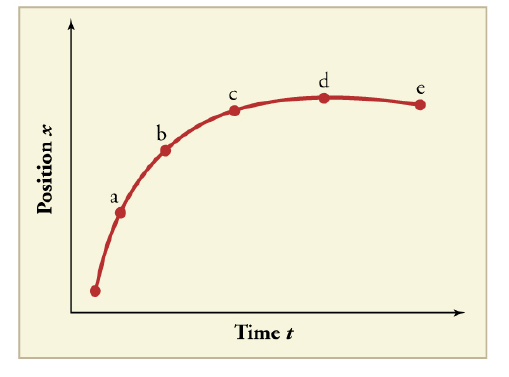
(a) Explain how you can use the graph of position versus time in Figure 2.54 to describe the change in velocity over time, Identify (b) the time (ta, tb, tc, td, or te) at which the instantaneous velocity is greatest, (c) the time at which it is zero, and (d) the time at which it is negative,
(a) Explain how you can use the graph of position versus time in Figure 2.54 to describe the change in velocity over time, Identify (b) the time (ta, tb, tc, td, or te) at which the instantaneous velocity is greatest, (c) the time at which it is zero, and (d) the time at which it is negative,

Liked by erlamay123

Ankit LalLv10
21 Jan 2021