2
answers
1
watching
238
views

21 May 2021
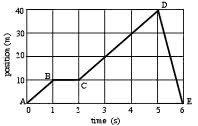
The graph below shows the relationship between distance, d, and time, t, for an object moving in a straight line.

13. Which of the graphs below could represent the velocity-time graph that matches the position-time graph above?

The graph below shows the relationship between distance, d, and time, t, for an object moving in a straight line.
13. Which of the graphs below could represent the velocity-time graph that matches the position-time graph above?
Liked by viridianantelope666


Read by 9 people