MATH 110 Study Guide - Comprehensive Midterm Guide: Exploratory Data Analysis, Arrow Keys, Bar Chart

Document Summary
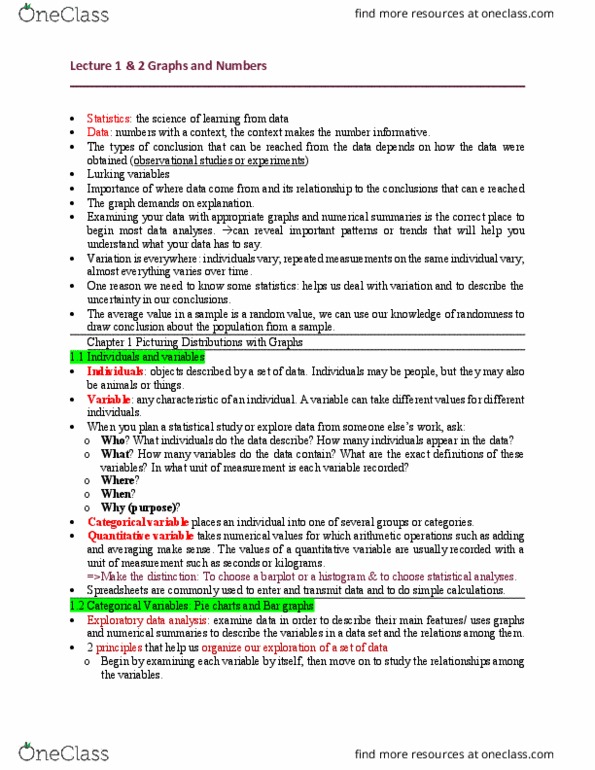
Individuals are the objects described by a set of data. Individuals may be people but they can also be animals or things. A variable can take different values for different individuals. Categorical variable places individuals into one of several groups or categories. Quantitative variable take the numerical values for which arithmetic operations such as adding and averaging make sense. Usually recorded with a unit of measurement such as seconds or kilograms. Spreadsheets are commonly used to enter and transmit data to do calculations. Exploratory data analysis helps us examine data in order to describe their main features. The distribution of a variable tells us what value it takes and how often it takes these values. The distribution of categorical variable lists the categories and gives either the count of the percent of individuals who fall into each category. Pie charts show the distribution of a categorical variable as a pie whose slices are sized by the.