PSY230H5 Lecture Notes - Lecture 2: Scatter Plot, Nomothetic

Document Summary
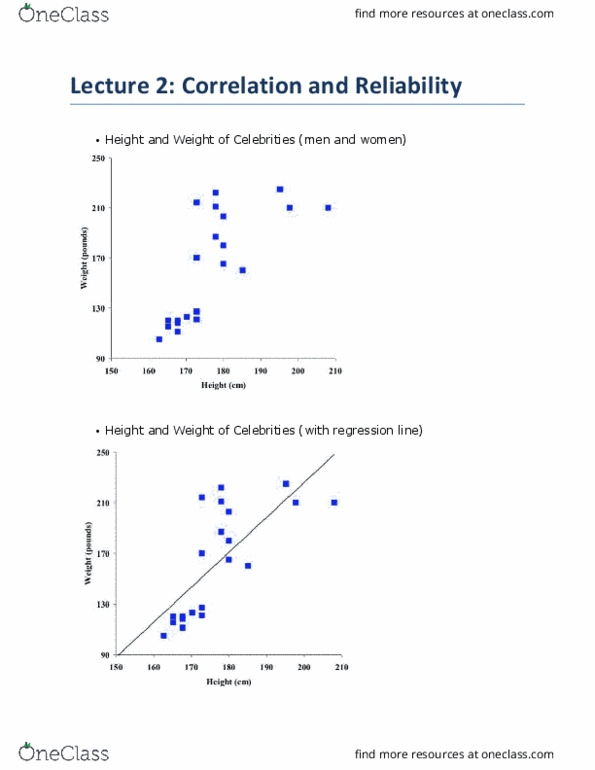
The sign tells us the type of correlations (positive or negative) the bigger the number (up to 1) is the strength of the relationship. He writes test questions about things he talks a lot about! Use the nomothetic approahc and reduce him down to just his height and his weight. Regression line (define it) check accuracy by seeing how many you really miss. The closer they are to the line the better we are able to predict a relationship and be able to make a better prediction. R2= 54 means the variance is caused by height and the other 46 is by something else other than height (variation) (??) Equal number says that there is no relationship. There is an equal chanc that you are short (h-) and underwight (w-) as being short and overweight (w+) Correlation in the second one is 50. that you are more likely be short and underwight (75) than short and overwight (25)