Question 1 - to be completed in Jupyter
a)
(i) Provide a visual summary of each respective variable, and explain why your chosen method to visualise the data is appropriate for this type of data. [2]
(ii) Comment on the results of your summaries. [1]
(iii) Provide a scatterplot of y versus x. Give meaningful labels to the axes. [1]
(iv) Do you think a simple linear regression model of y versus x would be a good fit to the data? Explain why, or why not
b) Find appropriate transformations for the data. In particular:
(i) Given your results from part (a), suggest three possible transformations for y and explain why these would be reasonable to try. [1]
(ii) Provide scatterplots of each of your transformed responses versus x. Explain which, if any, of these look promising for fitting a simple linear regression model, possibly after transforming x. If none of them seem suitable, suggest one further transformation and try it, giving a reason for your choice. [3]
(iii) Select the two most promising looking transformations of y from above and, if necessary, transform x appropriately. Provide scatterplots of the transformed responses versus the possibly transformed explanatory variables and comment on them. If necessary, try different transformations of x. [2]
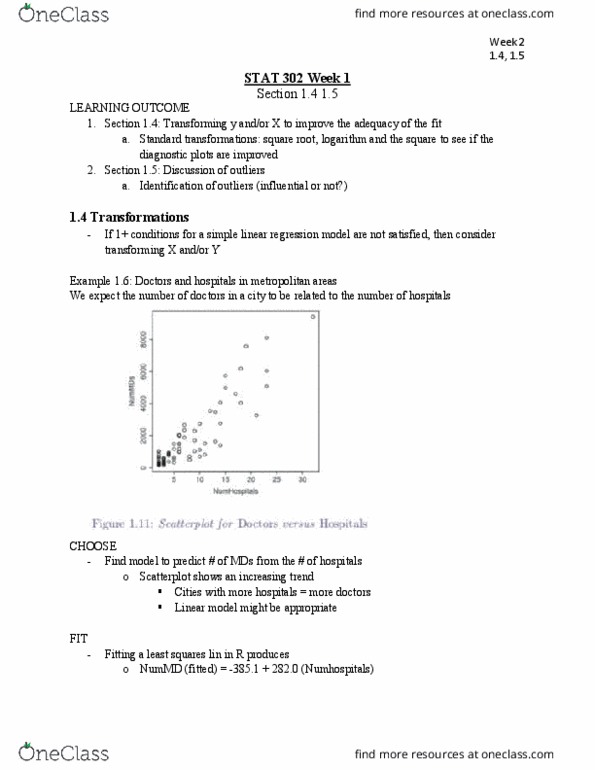
(c) Carry out a regression analysis of the data. In particular:
(i) Assume a senior statistician had decided to try the following two sets of transformations:
T1: Inverse square-root transformation of y and inverse transformation of x
T2: Inverse transformation of y and inverse transformation of x
Fit simple linear regression models, M1 and M2, to the two transformed data sets T1 and T2, respectively, and use appropriate residual plots to check if the assumptions of the simple linear regression model hold. [6]
(ii) Based on your residual analysis, select your preferred model among M1 and M2 and provide the fitted model equation. [2]
(iii) Is there evidence of a linear relationship between the (transformed) response and the (transformed) explanatory variable in this model? Justify your answer. [2]
(d) A new industrial establishment from the same sector is to be opened soon, and HR is hiring 1600 workers.
(i) Predict how many supervisors will be needed according to your model, and provide a 95% prediction interval. [4]
(ii) Would it be reasonable if HR hired 176 supervisors? Explain why, or why not. [1]
(iii) If HR approached you to predict how many supervisors they would need if they were hiring 2600 workers, what should be your response?
x y 294 30 247 32 267 37 358 44 423 47 311 49 450 56 534 62 438 68 697 78 688 80 630 84 709 88 627 97 615 100 999 109 1022 114 1015 117 700 106 850 128 980 130 1025 160 1021 97 1200 180 1250 112 1500 210 1650 135
Question 1 - to be completed in Jupyter
a)
(i) Provide a visual summary of each respective variable, and explain why your chosen method to visualise the data is appropriate for this type of data. [2]
(ii) Comment on the results of your summaries. [1]
(iii) Provide a scatterplot of y versus x. Give meaningful labels to the axes. [1]
(iv) Do you think a simple linear regression model of y versus x would be a good fit to the data? Explain why, or why not
b) Find appropriate transformations for the data. In particular:
(i) Given your results from part (a), suggest three possible transformations for y and explain why these would be reasonable to try. [1]
(ii) Provide scatterplots of each of your transformed responses versus x. Explain which, if any, of these look promising for fitting a simple linear regression model, possibly after transforming x. If none of them seem suitable, suggest one further transformation and try it, giving a reason for your choice. [3]
(iii) Select the two most promising looking transformations of y from above and, if necessary, transform x appropriately. Provide scatterplots of the transformed responses versus the possibly transformed explanatory variables and comment on them. If necessary, try different transformations of x. [2]
(c) Carry out a regression analysis of the data. In particular:
(i) Assume a senior statistician had decided to try the following two sets of transformations:
T1: Inverse square-root transformation of y and inverse transformation of x
T2: Inverse transformation of y and inverse transformation of x
Fit simple linear regression models, M1 and M2, to the two transformed data sets T1 and T2, respectively, and use appropriate residual plots to check if the assumptions of the simple linear regression model hold. [6]
(ii) Based on your residual analysis, select your preferred model among M1 and M2 and provide the fitted model equation. [2]
(iii) Is there evidence of a linear relationship between the (transformed) response and the (transformed) explanatory variable in this model? Justify your answer. [2]
(d) A new industrial establishment from the same sector is to be opened soon, and HR is hiring 1600 workers.
(i) Predict how many supervisors will be needed according to your model, and provide a 95% prediction interval. [4]
(ii) Would it be reasonable if HR hired 176 supervisors? Explain why, or why not. [1]
(iii) If HR approached you to predict how many supervisors they would need if they were hiring 2600 workers, what should be your response?
x y 294 30 247 32 267 37 358 44 423 47 311 49 450 56 534 62 438 68 697 78 688 80 630 84 709 88 627 97 615 100 999 109 1022 114 1015 117 700 106 850 128 980 130 1025 160 1021 97 1200 180 1250 112 1500 210 1650 135