FINS1613 Study Guide - Quiz Guide: Cash Flow, Net Present Value, Capital Market
44 views6 pages

Get access
Grade+
$40 USD/m
Billed monthly

Homework Help
Study Guides
Textbook Solutions
Class Notes
Textbook Notes
Booster Class
10 Verified Answers
Related Documents
Related Questions

Using the following information, write a one page narrative of what is found in the information below:
Please include answers to these two questions in the narrative.
Which firm would have the higher expected return between the unlevered equity holder and the levered equity holder? (show all the team calculations in arriving at the final answer).
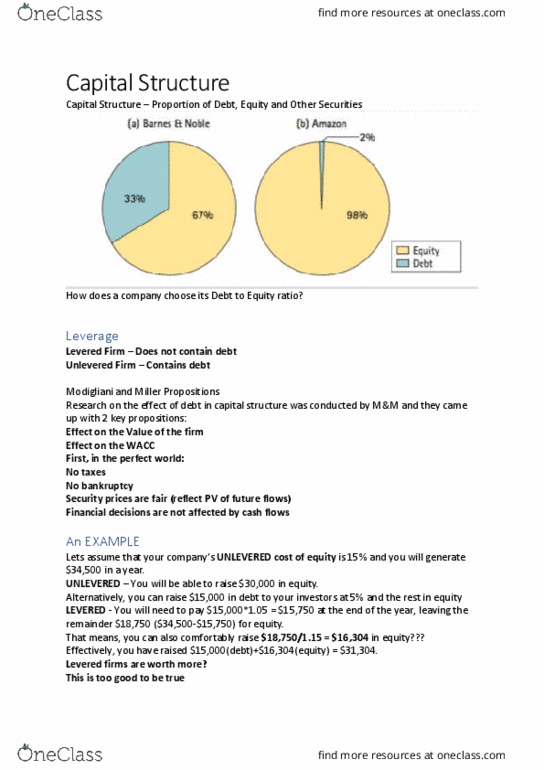
2. How does the risk and cost of capital of levered equity compare to that of unlevered equity? Which is the superior capital structure choice for a perfect capital market, and why?
| Expected CashFlow | =.50(Weak Cash Flows)+.50(strong Cash Flows) | |||||
| Expected CashFlow | 103,500.00 | |||||
| NPV | $ 9,224.14 | =-B6+(B2/(1+B7+B8)) | ||||
| The investment has a positive NPV | ||||||
| PV | $ 89,224.14 | =+B2/(1+B9) | ||||
| Cash Flow-weak economy | 90,000.00 | |||||
| Cash Flow-strong economy | 117,000.00 | |||||
| Initial Investment | 80,000.00 | |||||
| Cost of Capital | 16.00% | |||||
| Risk-free Rate | 5.00% | |||||
| Cash Flows and Returns for Unlevered Equity | ||||||
| Date 1: Cash Flow | Date 1: Return | |||||
| Strong | Weak | Strong | Weak | |||
| NPV | $ 9,224.14 | |||||
| PV | $ 89,224.14 | 117,000.00 | 90,000.00 | 31.13% | 0.87% | |
| Values & Cash Flows for Debt & Equity of the Levered Firm (Table 14.3) | ||||||
| Date 0 | Date 1: Cash Flow | |||||
| Initial Value | Strong Economy | Weak Economy | ||||
| Debt | 45,000 | 47,250 | 47,250 | |||
| Levered equity | 69,750 | 42,750 | ||||
| Firm | 89,224 | 117,000 | 90,000 | |||
| Returns to Equity with and without Leverage (Table 14.4) | ||||||
| Date 0 | Date 1: Cash Flow | Date 1: Returns | ||||
| Initial Value | Strong Economy | Weak Economy | Strong Economy | Weak Economy | Expected Return | |
| Debt | 45,000 | 47,250 | 47,250 | 5.00% | 5.00% | 5.00% |
| Levered Equity | 44,224 | 69,750 | 42,750 | 57.72% | -3.33% | 27.19% |
| Unlevered equity | 89,224 | 117,000 | 90,000 | 31.13% | 0.87% | 16.00% |
| Systematic Risk and Risk Premiums for Debt, Unlevered Equity, and Levered Equity (Table 14.5) | ||||||
| Return Sensitivity (Systematic Risk) | Risk Premium | |||||
| Debt | 0.00% | 0.00% | ||||
| Levered Equity | 61.05% | 0.00% | 11.00% | |||
| Unlevered Equity | 30.26% | -15.13% | 22.19% | |||
