ECON 1008 Study Guide - Final Guide: Probability Plot, Dfs Furniture, Marginal Distribution

20 Sep 2018
School
Department
Course
Professor
Document Summary
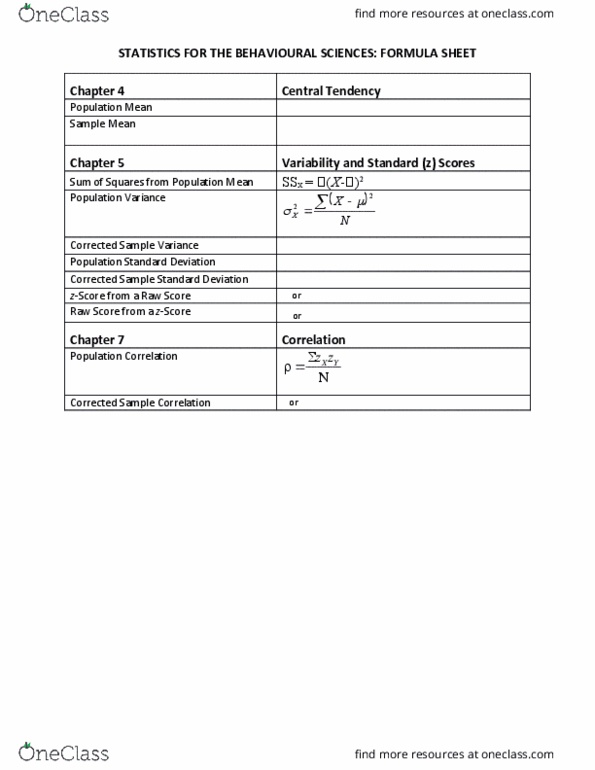
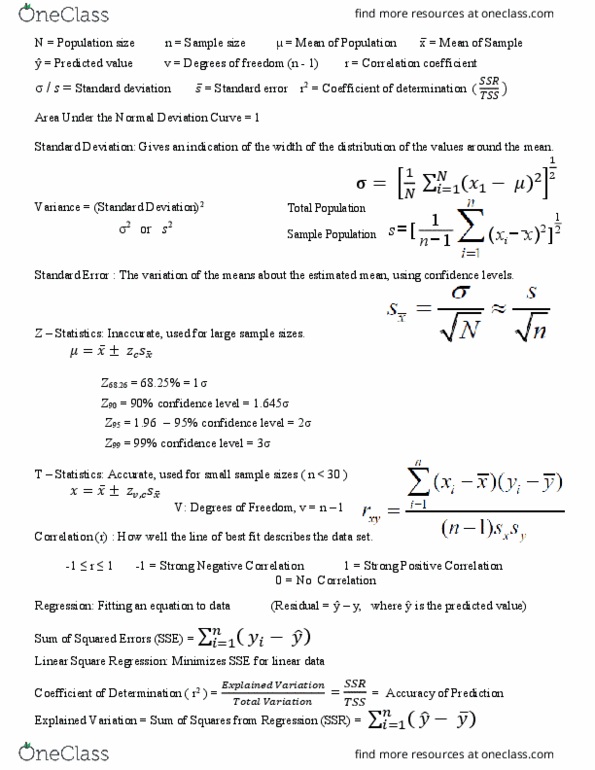
Statistic y s2 s r n p b. Quantitative data (numerical): data has known units and is measurable. Qualitative data (categorical): the data are counts or percentages of individuals in categories. Discrete data: you can count the outcomes (e. g. cars passing a point) Continuous data: you can measure the outcomes (e. g. weights) When averages are taken across different groups, they can appear to contradict the overall averages. This occurs when tables of unequal rows totals are pooled. Bar chart has spaces between bars displays categorical (qualitative) data. Peaks no spaces between bars displays quantitative data are called modes. Skewed to the side of the longer tail. (right skew . Split the data in 2 at the median (if n is odd, include the median in both halves) Find the median of each half- these are the quartiles. Min, q1, median, q3, max (+n size) The middle value(s) of a set of ordered data values.