STAT11-112 Study Guide - Final Guide: Test Statistic, Statistical Hypothesis Testing, Statistic


Week 6
Continues probability distribution
The probability of each individual value is 0.
Equal/greater than/ less than are the same thing
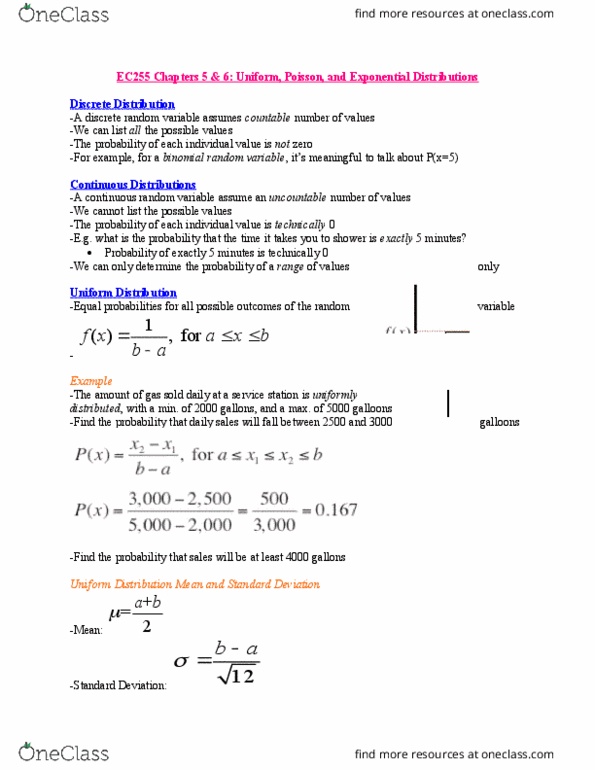
Discrete data – countable number of possible values, probability distributions can be put in tables
Continues data- infinite number of possible values, a smooth function describes the probabilities f(x) is
called a probability density function
Possible shares of f(x)
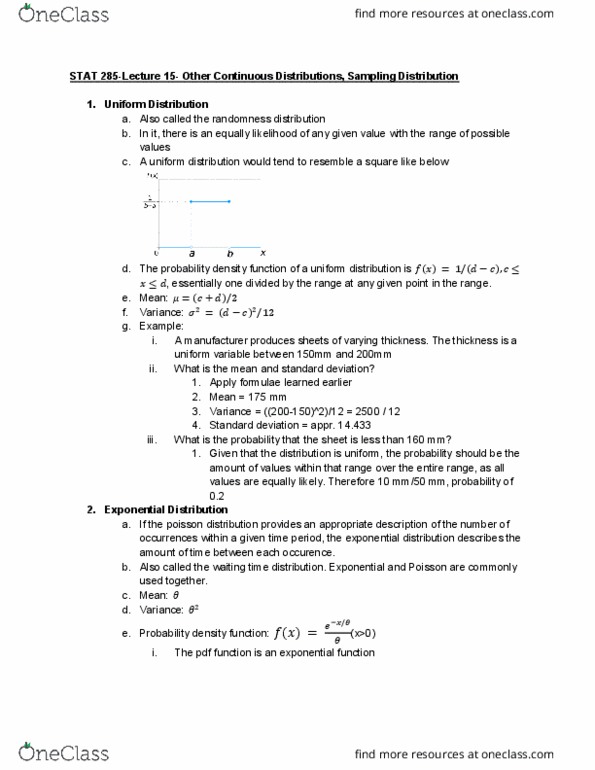
Uniform distribution
Exponential distribution
Can be used to model
-the length of time between …
the lifetime of electronic components
When the number of occurrences of an event follows the Poisson distribution, the time between
occurrences follows an exponential distribution
“events occur randomly and independently at a constant average rate”
find more resources at oneclass.com
find more resources at oneclass.com

Normal distribution
Described by only two parameters: mean and standard deviation
Continues, bell shaped, unimodal at mean=median, area under the curve= probability
.
find more resources at oneclass.com
find more resources at oneclass.com

Week 7
Sampling distribution
Terminology:
action: sample from a population
aim: estimate a population characteristic using simple data
the means from multiple samples will form a distribution – sampling distribution of the mean
Sampling error declines as sample size increases.
Probability Samples we know the probability that things should occur- more fact based
Sample random sampling
-Every individual or item from the frame (N) has an equal chance of being selected (1/N)
(selection may be with or without replacement)
-Can use table of random numbers or computer random number of generators
-Simple to use, but may not be a good representative of the population’s underlying characteristics
find more resources at oneclass.com
find more resources at oneclass.com
Document Summary
The probability of each individual value is 0. Equal/greater than/ less than are the same thing. Discrete data countable number of possible values, probability distributions can be put in tables. Continues data- infinite number of possible values, a smooth function describes the probabilities f(x) is called a probability density function. The length of time between the lifetime of electronic components. When the number of occurrences of an event follows the poisson distribution, the time between occurrences follows an exponential distribution. Events occur randomly and independently at a constant average rate . Described by only two parameters: mean and standard deviation. Continues, bell shaped, unimodal at mean=median, area under the curve= probability. Terminology: action: sample from a population aim: estimate a population characteristic using simple data the means from multiple samples will form a distribution sampling distribution of the mean. Probability samples we know the probability that things should occur- more fact based.