ECON204 Study Guide - Final Guide: Financial Crisis Of 2007–2008, Gdp Deflator, Nominal Interest Rate

17 May 2018
School
Department
Course
Professor

Topic 1
Crisis
• 00-07 sustained global expansion. US housing prices doubled. In 07, house prices declined.
• Poor quality mortgage loans were made during expansion. Borrowers ouldt ake mortgage repayments.
Soon mortgage > house value, giving them an incentive to default.
• Banks had repackaged and sold mortgages as securities, which were further repackaged and sold, leading to
complexity and opaqueness. When stock market prices fell, housing problem became a major financial crisis.
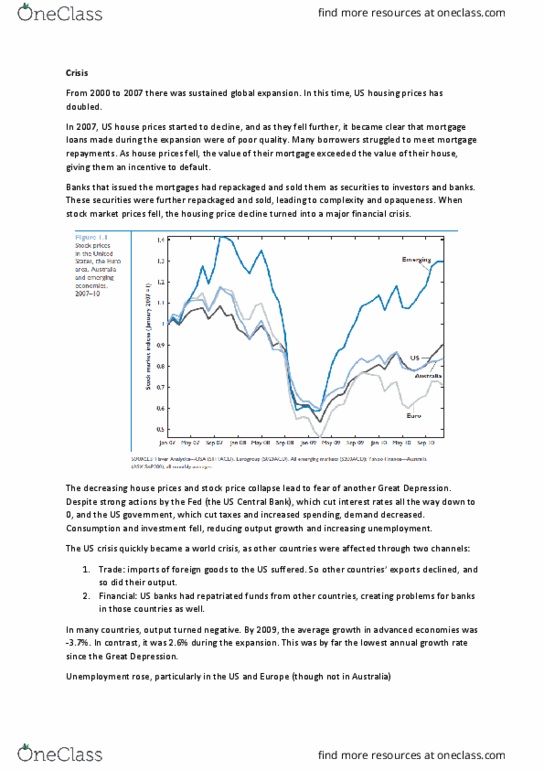
• The decreasing house prices and stock price collapse lead to fear of another Great Depression. The Fed cut
interest rates to 0, expansionary fiscal policy was implemented, but demand decreased. C and I fell, reducing
output growth and increasing unemployment.
• The US crisis quickly became a world crisis:
o Tade: othe outies epots delied, ad so did thei output.
o Financial: US banks had repatriated funds from other countries.
• In many countries, output turned negative. By 2009, the average growth in advanced economies was -3.7%
(Lowest since the Great Depression) It was 2.6% during expansion.
• Unemployment rose, particularly in the US and Europe (though not in Australia)
Responses to the GFC
• Emerging and developing economies have largely recovered. Their exports have increased, and foreign funds
have returned. Increasing inflation even indicates economic overheating.
• Advanced countries have many remaining problems. E.g. persistently high unemployment in Europe and US,
caused by low output growth. As output declined, so did government revenue, leading to a large increase in
budget deficits (a large increase in public debt)
• Stimulative monetary and fiscal policy to help ease the crisis.
• Monetary policy:
o Interest rates cut near 0, and some even marginally negative. They remain very low.
o Access to credit declines as banks unwilling to lend. Central banks used quantitative easing.
• Fiscal policy:
o Fiscal stimulus.
o Governments spent and borrowed a lot; fiscal deficits funded by debt.
o Many worry about too much government debt, and so governments have been holding back. This
has slowed the global recovery
• But risks are on the rise:
o Financial market volatility – fiaial isis happes o aeage ee eas…
o Is Chias ieased growth (6.9%) real? Credit fears – lots of borrowing.
o Continuing low inflation, risking deflation. Japan is always at risk of deflation.
o Geopolitical problems – terrorism, N.Korea, Syria, refugees, Brexit
Australia
How did Australia avert the worst effects of 2008 crisis?
1. The Mining Boom: Commodity (coal & iron ore) export prices have risen, thanks to emerging Asia,
particularly China. (higher returns for level of output).
2. Substantial fiscal stimulus from 2009 to 2011 by Rudd, then Gillard government. This pushed the fiscal
balance into an annual average deficit of about 6% of GDP.
3. Immediate and large response by the RBA, cutting the cash rate from 7% to 3% in 6 months. By 2010, the
economy stabilised (output and unemployment) without going into recession.
Issues
• How to respond to the continuing lukewarm world economy in 2017?
o Major trading partners (MTP) growth remains flat
o Is growth in China really 6.9% or will it slow down?
• Why are interest rates everywhere still so low?
o Wage growth and productivity have been slowing down
o Why is wage growth falling?
find more resources at oneclass.com
find more resources at oneclass.com

o Why is labour productivity so low?
o Housing market
o Underemployment rate has increased - labour market structure (part-time)
• The strengthening exchange rate in 2000-2014 was a problem for Australia.
o Strong exchange rate is tough for our non-mining exporters.
o But imports are very cheap
o If the RBA tightens monetary policy, the exchange rate will increase - limiting factor
Europe
Recent EU economic performance has been poor:
• Average output growth has been lower than in US
• Persistently high unemployment rate—now rising due to fiscal austerity
• Resultig soeeig det isis after 2010 made everything worse. (PIIGS)
Issues:
• High unemployment.
o Even the pre-crisis level was already high at 8.5%.
▪ It is argued that this is due to labour market institutions,
▪ It is expensive for firms to fire workers – discouraging hiring.
o Generous unemployment insurance – discourages job seeking.
o But other countries with the same policies (e.g. Netherlands and Denmark) have low unemployment.
• A common currency. (2002)
o Removes obstacles to trade
▪ No changes in relative price of currencies
▪ No need to change currencies when crossing borders
o But common monetary policy, and the same interest rate
• The effects of the large flow of refugees from the Middle East and Africa
• BREXIT. Will other countries go? Long run effects on the UK? On EU? On global economy?
China
• Growth has been high for 2 main reasons:
o Very high capital accumulation (40% of GDP), + low-cost labour moving from rural areas (but
consumption remains very low)
o Very fast technological progress, from foreign firms investing in China.
• Other:
o Entry to WTO in 2001 led to massive manufacturing exports
o Privatisations of inefficient State Owned Enterprises (SOEs) in 1990s
o Private housing markets in 1990s led to construction boom.
• This has led to rapid urbanization and industrialization
Why has China done better than other transition countries?
• China made a better transition from state planning to a market economy than central European countries
and Russia. Possible reasons:
o China had a slower and more controlled transition
o Communist Party retained control, giving better property rights protection.
Wh has Chias goth sloed i eet eas?
• Slowdown in contributions of real investment and net exports mainly due to weakness in Japan and Europe.
Their challenge is to increase consumption.
• Ageing society – worsening dependency ratio of retirees/worker. One child policy.
• Growing debt vulnerability; asset price bubbles?
find more resources at oneclass.com
find more resources at oneclass.com

Topic 2
GDP
Three definitions:
• Production side:
o GDP is the value of the final goods and service produced in the economy during a given period.
o GDP is the sum of value added in the economy during a given period.
• Income side:
o GDP is the sum of incomes in the economy during a given period.
Nominal and Real GDP
• Nominal GDP is the sum of the quantities of final goods produced times their current price.
• Nominal GDP increases over time because:
o The production of most goods increases over time.
o The prices of most goods also increase over time.
• Real GDP is constructed as the sum of the quantities of final goods times constant prices.
Australian Nominal and Real GDP
• Real GDP > Nominal GDP.
• Expansions and recessions are defined as such if they occur over a period greater than or equal to 2
quarters.
Unemployment
• Unemployment rate, participation rate
• Economists care about unemployment for two reasons:
o Unemployment has important social consequences.
▪ Welfare of the unemployed
o The unemployment rate gives them an indication of whether an economy is operating above or
below its normal level of activity.
▪ Inefficient use of human resources
Inflation
• Inflation rate:
o The GDP deflator is an index number—set equal to 100 in the base year. = Nominal GDP / Real GDP
o The rate of change in the GDP deflator equals the rate of inflation:
• The Consumer Price Index
o The CPI and the GDP deflator move together most of the time.
o Inflation of the Consumer Price Index and the GDP Deflator in Australia
▪ They differ in 2000s because of commodity prices.
▪ They can also differ when the products consumed (CPI) are not goods produced (GDP)
• Economists care about inflation for at least two reasons:
o Wages and prices do not move proportionately. So, it affects relative prices (e.g. the real wage) and
thus income distribution.
▪ E.g. paets that aet ideed, e.g. pesios i a outies
o It creates other distortions
▪ changes in relative prices create uncertainty and affect decision making
▪ inflation can affect taxes through tax bracket creep
▪ people oe ito highe ta akets, ee if thei eal ioe doest hage.
For equilibrium in the goods market, production, Y, must be equal to the demand for goods, Z
Z = C + I + G + NX,
where
• An increase in autonomous spending (such as government expenditure) has a more than one-for-one effect
on equilibrium output.
find more resources at oneclass.com
find more resources at oneclass.com
Document Summary
In 07, house prices declined: poor quality mortgage loans were made during expansion. Soon mortgage > house value, giving them an incentive to default: banks had repackaged and sold mortgages as securities, which were further repackaged and sold, leading to complexity and opaqueness. When stock market prices fell, housing problem became a major financial crisis: the decreasing house prices and stock price collapse lead to fear of another great depression. The fed cut interest rates to 0, expansionary fiscal policy was implemented, but demand decreased. C and i fell, reducing output growth and increasing unemployment: the us crisis quickly became a world crisis, t(cid:396)ade: othe(cid:396) (cid:272)ou(cid:374)t(cid:396)ies(cid:859) e(cid:454)po(cid:396)ts de(cid:272)li(cid:374)ed, a(cid:374)d so did thei(cid:396) output, financial: us banks had repatriated funds from other countries. By 2009, the average growth in advanced economies was -3. 7% (lowest since the great depression) it was 2. 6% during expansion: unemployment rose, particularly in the us and europe (though not in australia)