PHED-1106EL Study Guide - Final Guide: Central Limit Theorem, Central Tendency, Histogram

12 Sep 2018
School
Department
Course
Professor
Document Summary
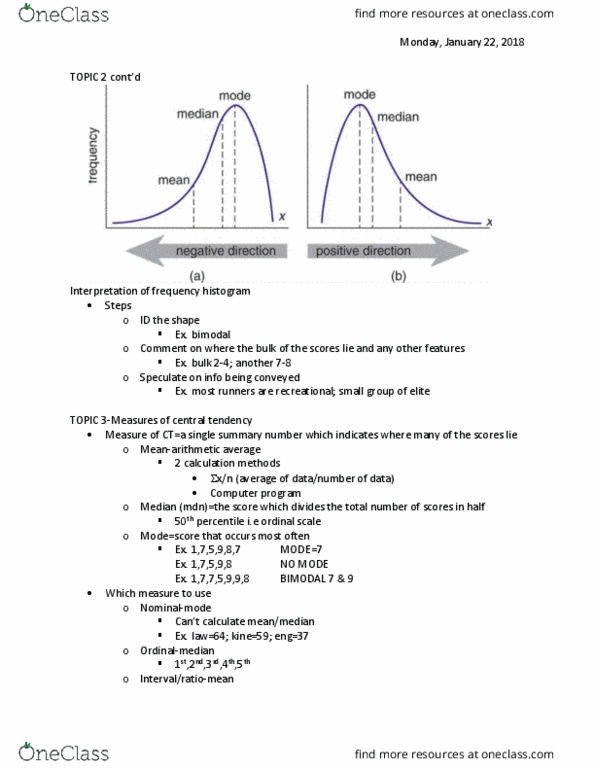
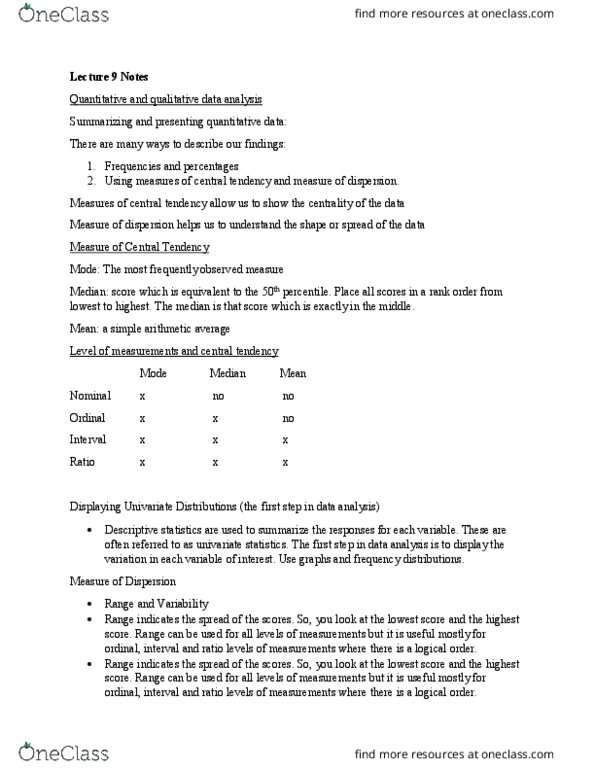
Hypothesis testing: belief, hypothesis, theory, tenet of human movement studies, First step to analyzing data is describing it. Histogram: a diagram consisting of rectangles whose area is proportional to the frequency of a variable and whose width is equal to the class interval. Variability: the degree of spread or dispersion that characterizes a group of scores and is the degree to which a set of scores differs from some measure of central tendency. Calculating variability: deviation: distance of each raw score from mean, variance: squares the deviation and take average, standard deviation: square root of variance. Understanding distributions: the normal or bell curve, represents how variables are distributed, characteristics, mean, median, and mode are all at the same value, symmetrical at midpoint. Inferential statistics: infer something about the population from which the sample was drawn based on characteristics of sample.