[STAT 2040] - Final Exam Guide - Comprehensive Notes for the exam (60 pages long!)

29 Nov 2016
School
Department
Course
Professor
Document Summary
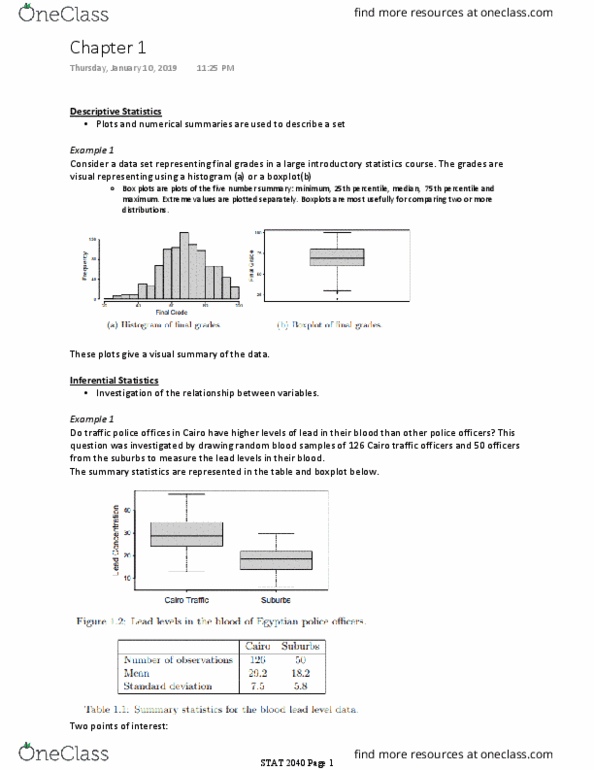
Once the data is collected, it needs to be summarized and illustrated with plots and numerical summaries. Descriptive statistics: describing a set of data using plots and numerical summaries: eg: histogram or boxplot showing a class" final grades, gives an effective visual summary of the data set. Boxplots are useful for comparing the distributions of two or more groups. In statistics, and the world in general, we hardly ever know anything for sure. Our statements and conclusions involve a measure of the reliability of our estimates. Individuals/units/cases: the objects on which a measurement is taken: eg: bags of popcorn to see if the nutritional values given are accurate. Population: the set of all individuals or units of interest to an investigator. Sample: a subset of individuals or units selected from the population: eg: 20 random bags of popcorn selected from a larger group.