STAT 301 Study Guide - Final Guide: Squared Deviations From The Mean, The Intercept, Dependent And Independent Variables

Document Summary
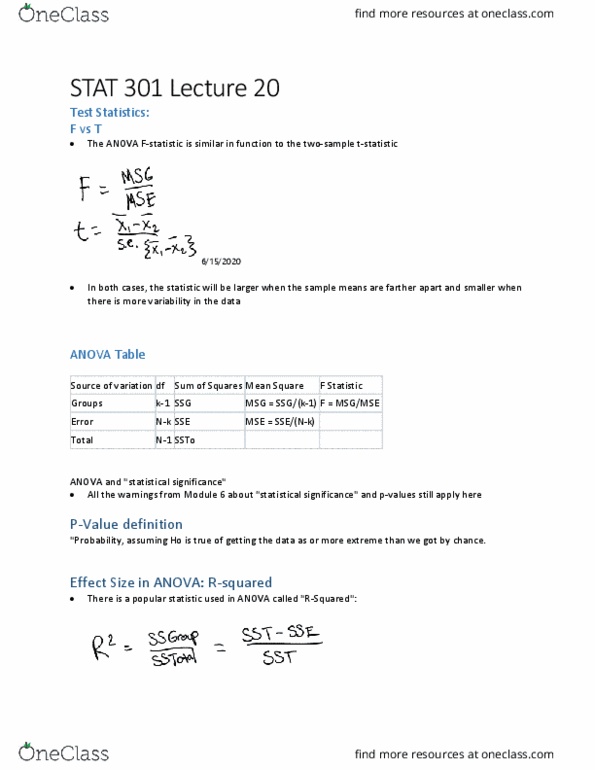
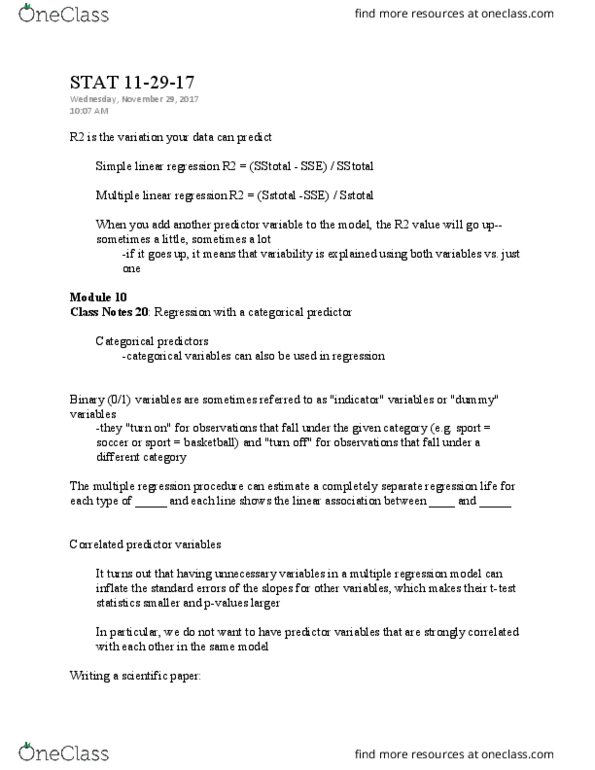
Interpreting b0: the intercept b0 is the predicted value of y when x=0. Interpreting b1: b1, the slope, is the change in y for a one unit increase in x. "the vertical distance between a data point and the lobf" Sse (error sum of squares) (anova) "sum of the squared deviations between each data point and its group means" (linear regression) "sum of all the squared deviations between each data point and the lobf" In other words: sum of the squared residuals. Sse roughly quantifies how spread out the data are around the lobf: larger the sse, more spread out the data are around lobf. If data all formed a perfectly straight line, sse would be 0: this all means that the lobf comes from the smallest sse possible. The larger the sse, the closer r-squared is to 0: higher r-squared = tighter fight to line. Extrapolation: we cannot make predictions about data that is outside of our range.