BNAD 276 Study Guide - Midterm Guide: Contingency Table, Kurtosis, Skewness

27 Sep 2017
School
Department
Course
Professor
Document Summary
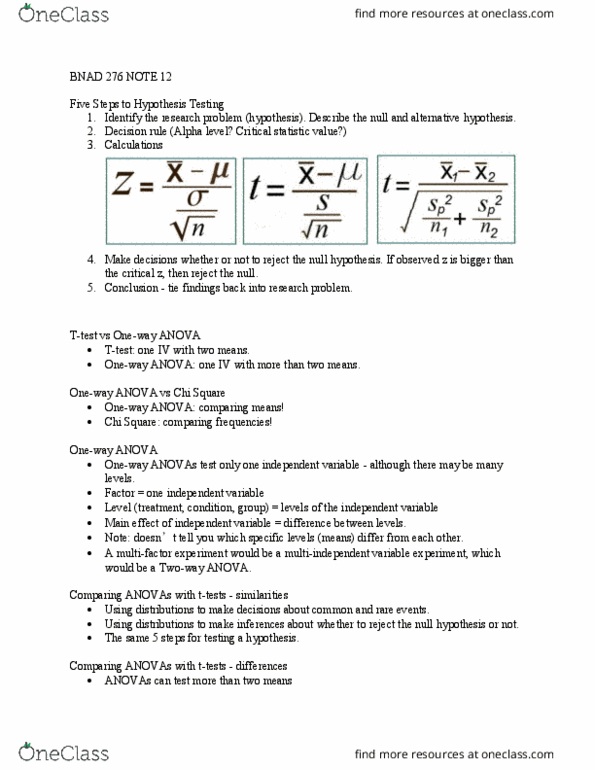
Measures how much the observed frequencies differ from the expected frequencies. Ei = expected frequency in ith category (n x pi) Calculating the expected frequencies for a test for independence: Used to calculate the expected frequencies for each cell in a contingency table (cid:3036)(cid:3037)= (cid:4666)(cid:1844)(cid:1867)(cid:1875) (cid:1861) (cid:1872)(cid:1867)(cid:1872)(cid:1864)(cid:4667)(cid:1876)(cid:4666)(cid:1829)(cid:1867)(cid:1864)(cid:1873)(cid:1865)(cid:1866) (cid:1862) (cid:1872)(cid:1867)(cid:1872)(cid:1864)(cid:4667) (cid:1845)(cid:1865)(cid:1868)(cid:1864) (cid:1845)(cid:1861) Used for a test for independence applied to a contingency table with r rows and c columns. Oij = observed frequency for each respective cell in contingency table. Eij = expected frequency for each respective cell in contingency table. Chi-square test statistic for the goodness-of-fit test for normality. The goodness-of-fit test can also be used to determine if a population has a particular probability distribution. Df = k-1 (k= the number of categories) Oi = observed frequency in ith category. Ei = expected frequency in ith category (n x pi: careful, must calculate the proportion using the z table. Jarque-bera test statistic for the goodness-of-fit test for normality.