WGS 2240 Study Guide - Final Guide: Percentile, Central Limit Theorem, Scatter Plot

16 Dec 2016
School
Department
Course
Professor
Document Summary
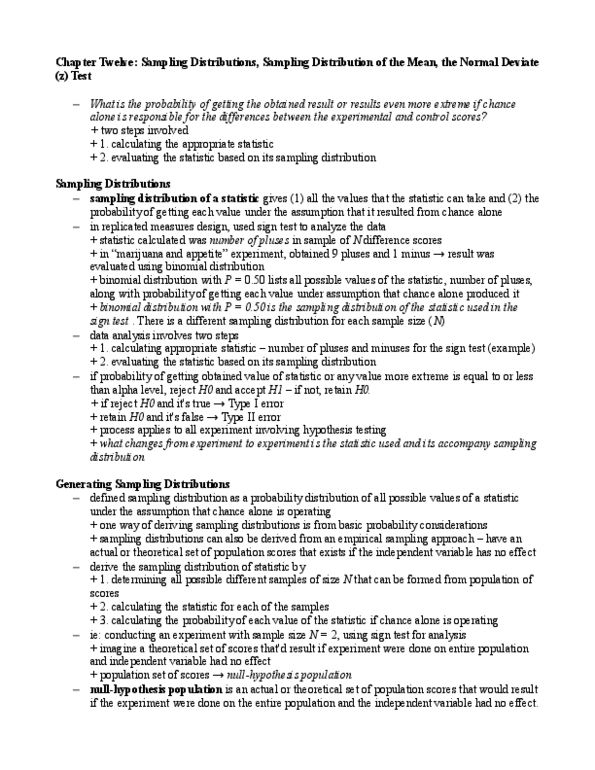
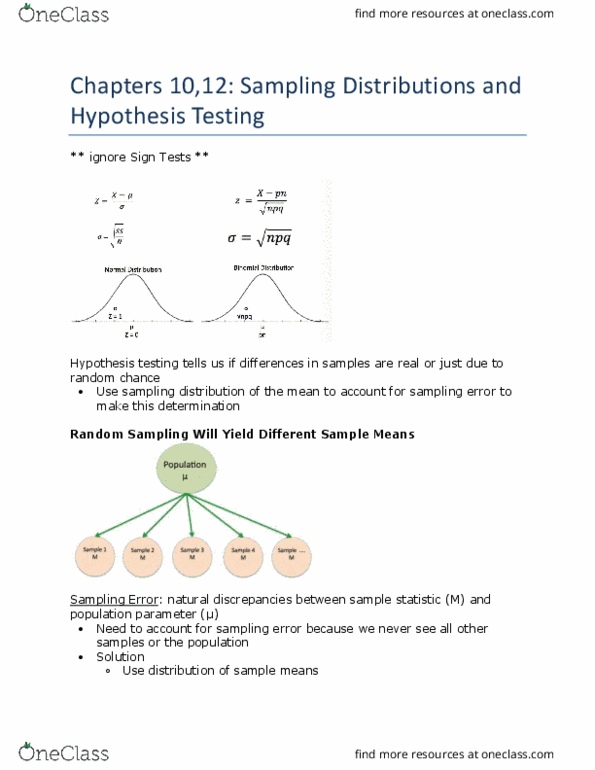
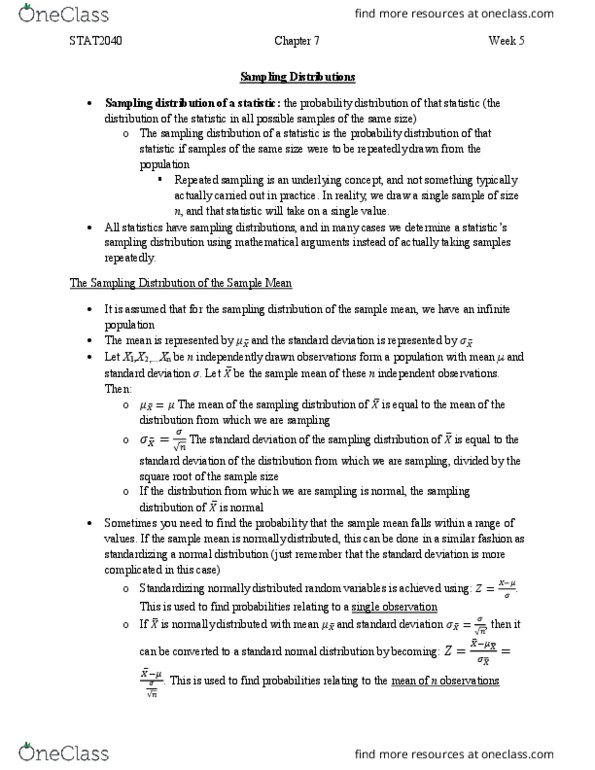
Repeatedly selecting a sample n from a population and calculating a statistic (usually the mean) for each sample. Building a sampling distribution: take all possible samples from the population, calculate the sample statistic for each sample (usually mean, plot the distribution, assume frequency reflects probability density. Why: theoretically: required to allow for deviance testing of any one sample obtained. In practice: impossible to measure, so one can make assumptions as to what it is likely to be. Factors affecting sampling distributions: sample size (n, sampling method (random or bias, statistic, shape of population distribution. Choose or create the most appropriate statistic. Measure the sample, calculate the sample statistic. Determine the location of the sample statistic in the sampling distribution. Calculate the probability of obtaining the result or one or more extreme the area under the tails of the sampling distribution this is the p value. The probability that the experiment will reject the h0 given h1 is true.