BUSS1020 Chapter Notes - Chapter 15: Time Series, Covariance, Linear Regression

28 May 2018
School
Department
Course
Professor

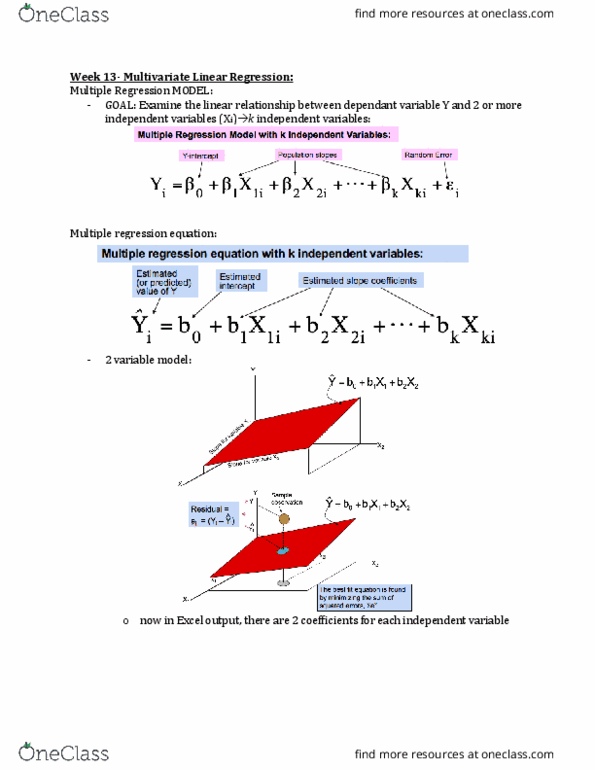
CHAPTER 15: INTRODUCTION TO MULTIPLE REGRESSION
DEVELOPING A MULTIPLE REGRESSION MODEL
• Used to examine the linear relationship between dependent, Y, and several independent variables, Xi
• The coefficients of the multiple regression model are estimated using sample data
• Coefficient of multiple determination: reports the proportion of total variation in Y explained by all X variables
taken together
o
R2, ADJUSTED R2 AND THE OVERALL F TEST
• Adjusted r2: shows the proportion of variation in Y explained by all X variables adjusted for the number of X
variables used
o where k = number of independent variables
o
o Never decreases when a new X variable is added to the model
o Can be a disadvantage when comparing 2+ models
o Net effect of adding a new variable: Lose a degree of freedom when new X variable added
o F-test for overall significance of model: tests if any of X variables are related to Y
§ Hypotheses:
§ F-distribution is an extension of the student-t distribution à quadratic function of a set of t-stats
• It has 2 degrees of freedom
•
§ In regression, 1st F df is the no. X variables (k), 2nd df is that remaining after estimating the model
(n – k – 1) and the F is a quadratic function of the set of t-stats on each regression coefficient
§ Test statistic:
• Numerator df = k
squares of sum total
squares of sum regression
SST
SSR
r==
2
ú
û
ù
ê
ë
é÷
ø
ö
ç
è
æ
--
-
--=
1
1
)1(1 22
kn
n
rradj
2
2
2
2
ˆ
1
1
1
1
1
s
SST
SSE
kn
n
r
SST
SSE
r
adj
e
s
-=
÷
ø
ö
ç
è
æ
--
-
-=
-=
2
1, 2 2nn
Ft
--
º
1--
==
kn
SSE
k
SSR
MSE
MSR
FSTAT
Document Summary
Developing a multiple regression model: used to examine the linear relationship between dependent, y, and several independent variables, xi. The coefficients of the multiple regression model are estimated using sample data: coefficient of multiple determination: reports the proportion of total variation in y explained by all x variables taken together. Sst regression sum of squares total sum of squares. R2, adjusted r2 and the overall f test: adjusted r2: shows the proportion of variation in y explained by all x variables adjusted for the number of x variables used. 1 where k = number of independent variables. F-distribution is an extension of the student-t distribution quadratic function of a set of t-stats. In regression, 1st f df is the no. X variables (k), 2nd df is that remaining after estimating the model (n k 1) and the f is a quadratic function of the set of t-stats on each regression coefficient.