STAT 2507 Chapter Notes - Chapter 2: Standard Deviation, Quartile, Interquartile Range

17 Jan 2015
School
Department
Course
Professor
Document Summary
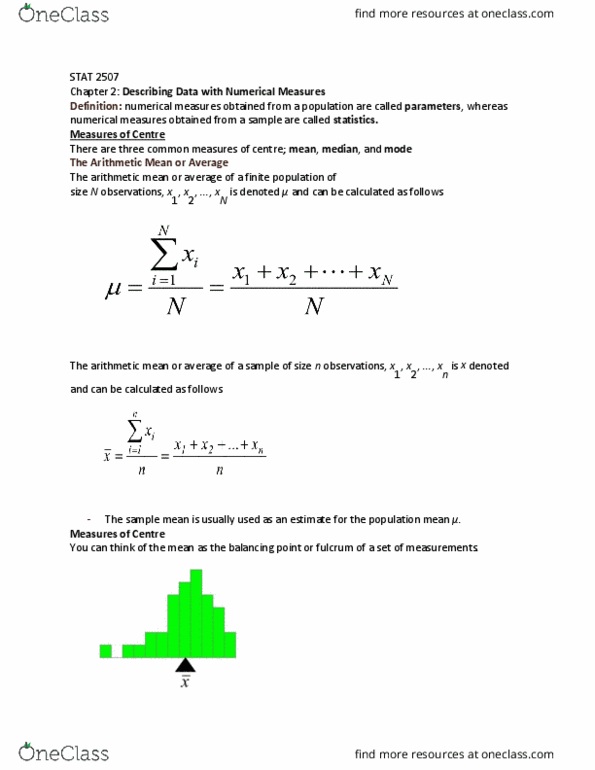
Graphical method may not always be su cient for describing data. You can use the data to calculate a set of numbers that will convey a good mental picture of the frequency distribu- tion. Numerical descriptive measures associated with a population of measurement are called pa- rameters; those computed from sample measurements are called statistics. (cid:70) measures of location: mean. This is the usual arithmetic mean or average and is equal to the sum of the measure- ments divided by number of measurements. (cid:80)n (cid:80)n i=1 xi n i=1 xi n. This is the middle of the measurements when ordered them. The position of the median = n + 1. The mode is measurement which occurs most frequently. Note: mean and median are equal when distribution of data is symmetric, mean is greater when distribution is skewed to right and is less than median when distribution is skewed to left.