STAT-2126EL Chapter Notes - Chapter 6-7: Homoscedasticity

Document Summary
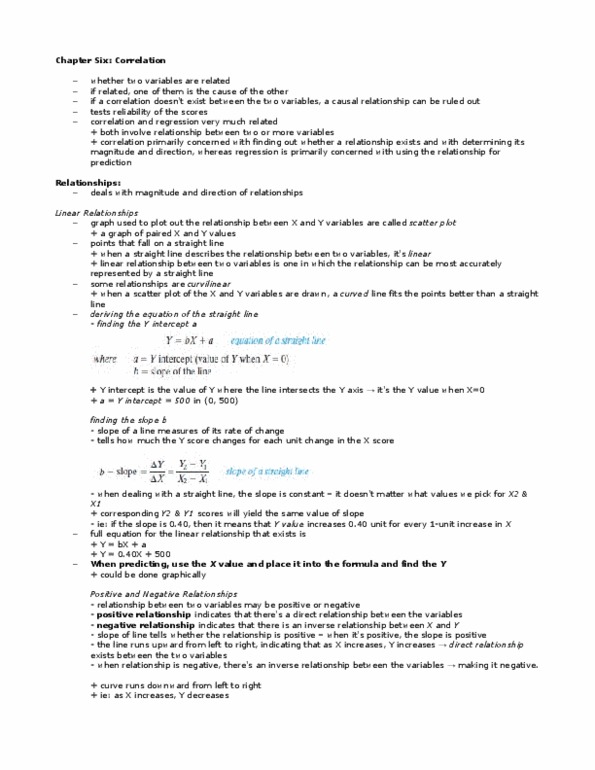
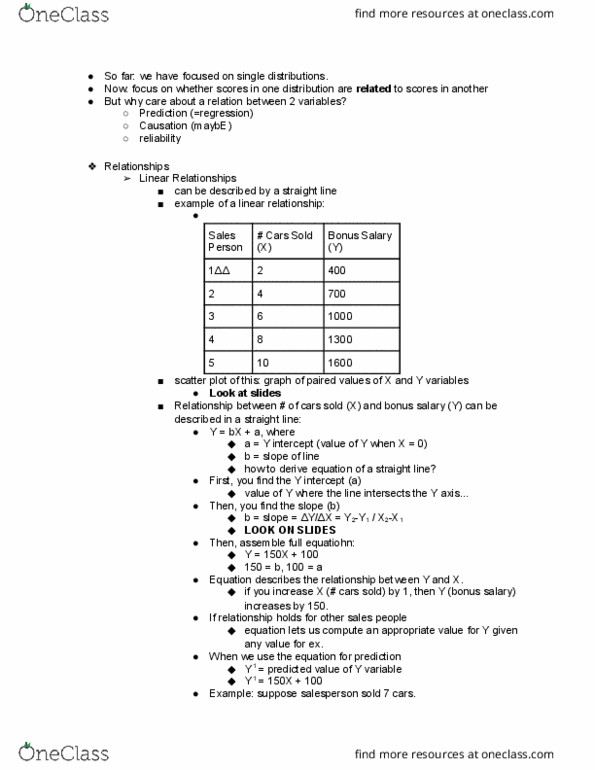
Scatter plot; a graph of paired x and y values. Linear relationship; the relationship can be most accurately represented by a straight line between two variables. Curvilinear; the relationship between two variables is curved. In this case, a curved line fits the data better than a straight line. Y= bx+a a= y intercept (value of y when x= 0) b= slope of the line. The y value of a function where the function intersects the y axis. Positive relationship; indicates that there is a direct relationship between the variables. Negative relationship; indicates that there is an inverse relationship between x and y. The slope of the line tells us whether the relationship is positive or negative. When the relationship is positive, the slope is positive, when the relationship is negative, the slope will therefore be negative. Higher values of x are associated with higher values of y. Lower values of x are associated with lower values of y.