PSYCH 1X03 Chapter Notes -Natural Sciences And Engineering Research Council, Transcranial Magnetic Stimulation, Type I And Type Ii Errors

23 Sep 2013
School
Department
Course
Professor

Document Summary
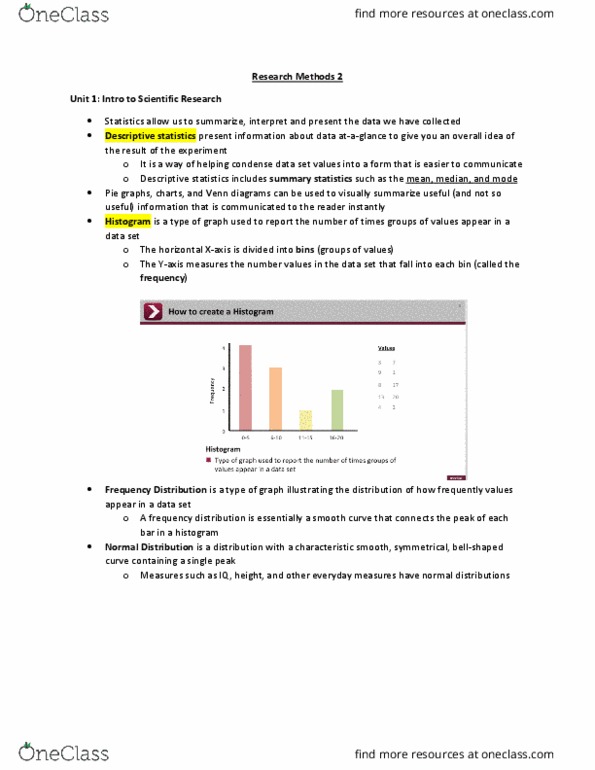
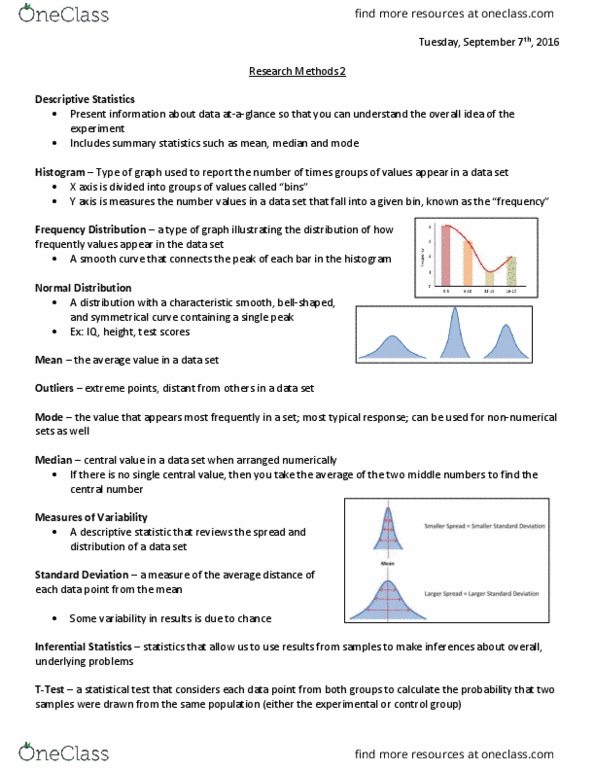
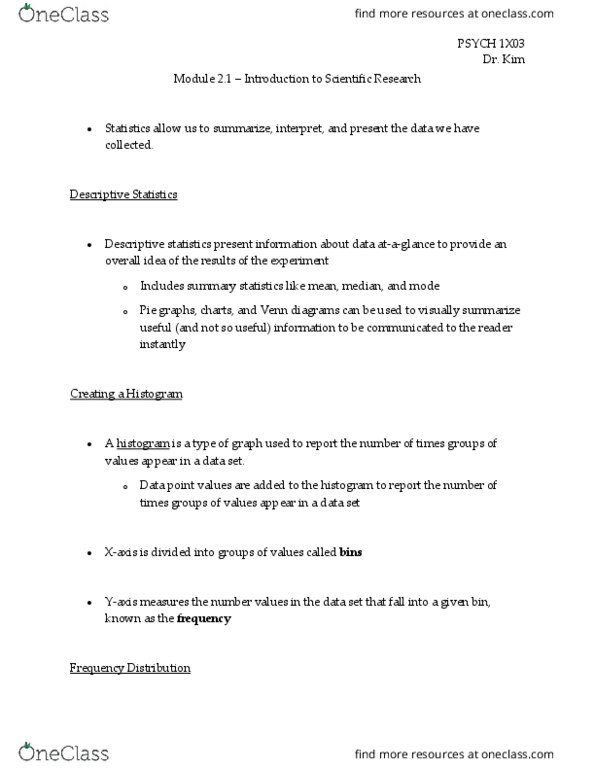
Statistics: summarize, interpret, and present the data we have collected. Descriptive statistics: present info about data at a glance to give you an overall idea of the results of the experiment - summary of mean, median and mode (all data based) Frequency distribution: graph illustrating the distribution of how frequency values appear in the data set- smooth curve that connects the peak of each bar in a histogram. Normal distribution: distribution with characteristic smooth, symmetrical, bell shaped curve containing a single peak. Average: common measure in the mean calculated by adding together all of the points in a data set and dividing by the number of items in the set. Outliers: extreme points, distant from others in a data set. Median: centre value in a data set when the set is arranged numerically. Mode: value that appears most frequently in the set (focuses on centre value but doesn"t tell us how the other values fall around that point)