ENVS278 Chapter Notes - Chapter 20: Randomized Experiment, Unimodality, Null Hypothesis

8 Oct 2016
School
Department
Course
Professor
Document Summary
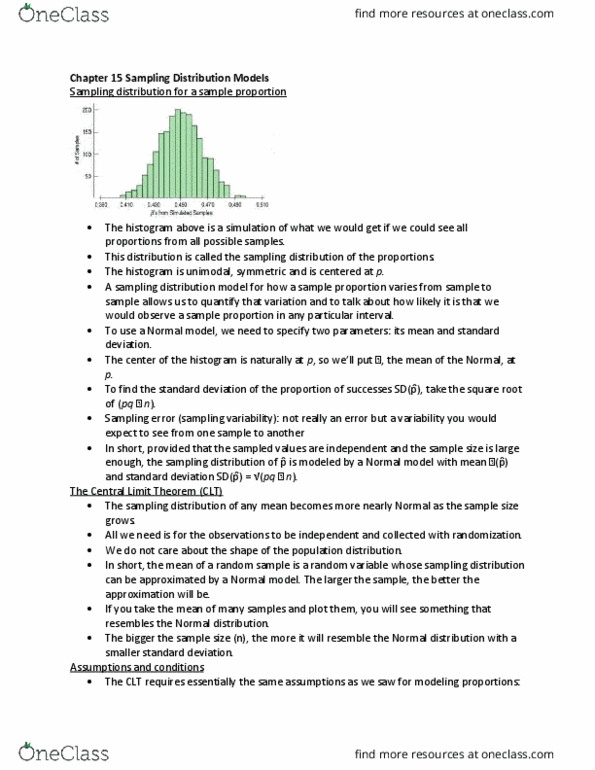
More on the clt and the sample distribution for sample means. The ctl says that all we need to model the sampling distribution of y-bar is of a random sample of quantitative data. Can first estimate the standard deviation using the formula sd(p )= (p x q-hat/n) But for means sd(y-bar) = ( / n), so knowing y-bar doesn"t tell us anything about sd(y-bar) We know n (the sample size) but the standard deviation could be anything. Now we estimate the population parameter with s the sample standard deviation based on the data. The t-model, degrees of freedom and the t-table. Sampling distribution model is always bell-shaped but the details change with different sample sizes, when sample size is large enough the model is not normal. So the student"s t-models form a whole family or related distributions that depend on a parameter known as degrees of freedom.