STAT211 Chapter 3: Descriptive Statistics

12 Jan 2018
School
Department
Course
Professor
Document Summary
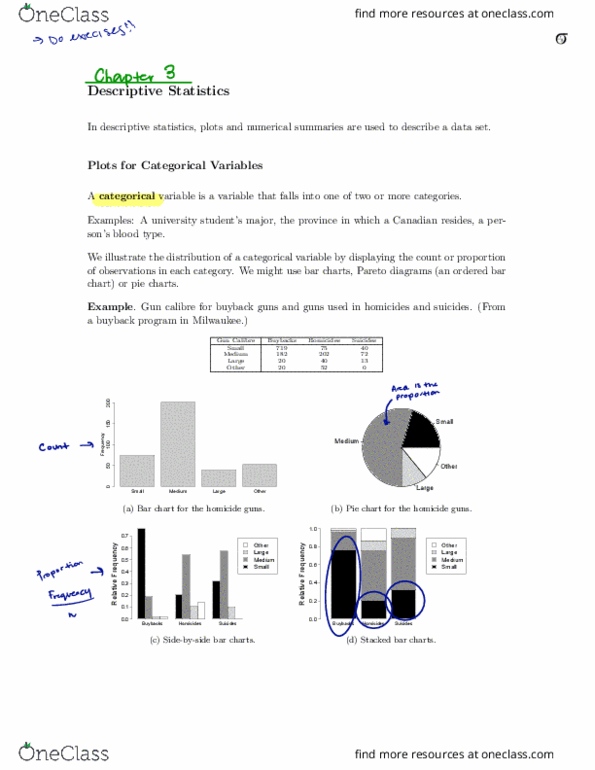
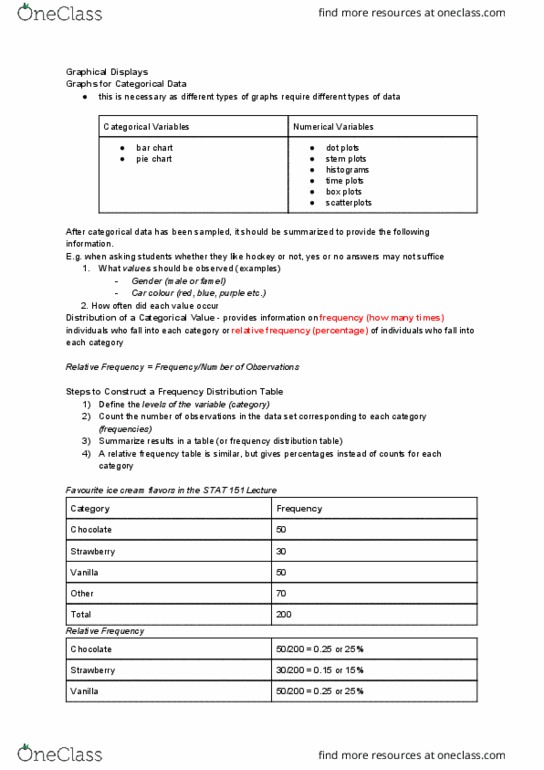
Descriptive statistics plots and numerical summaries are used to describe a data set. Plots for categorical variables: categorical variable, aka qualitative variable a variable that falls under one or more categories, student"s university program, blood type, can be illustrated using, bar charts. Split each observation into a stem and a leaf (tens and ones) List stems in ascending order in a column. List leaves in ascending order by their stems. Skewed towards the right: positively skewed, unimodal single peak, data can also be bimodal or multimodal. Summation notation add up all the x-values from the lower boundary to the upper boundary. Measures of central tendencies: mean, median, and mode, sample mean (x bar) - average of all the observations. If n is odd, median is the middle value. If n is even, median is the average of the two middle values: often used as the reported center in right-skewed and left-skewed data, mode most frequently occurring observation.