COMM 291 Chapter Notes - Chapter 4: Contingency Table, Bar Chart, Frequency Distribution


16
COMM 291 Full Course Notes
Verified Note
16 documents
Document Summary
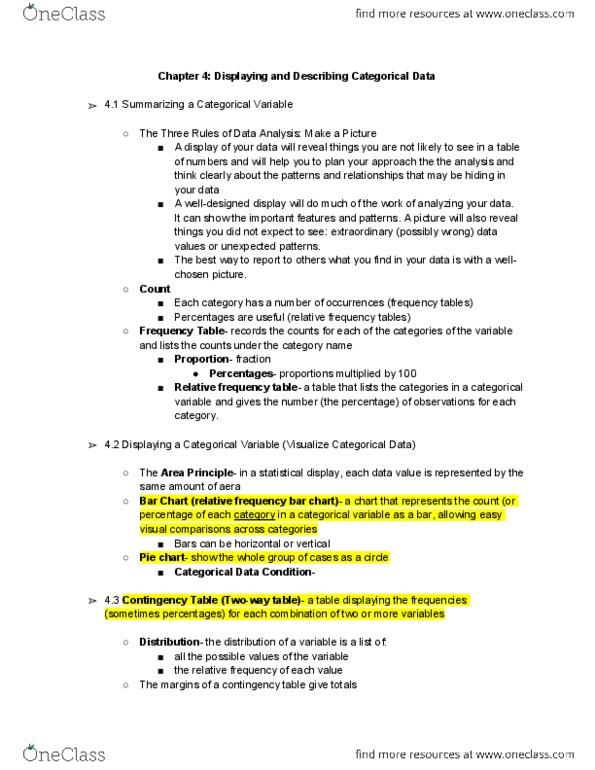
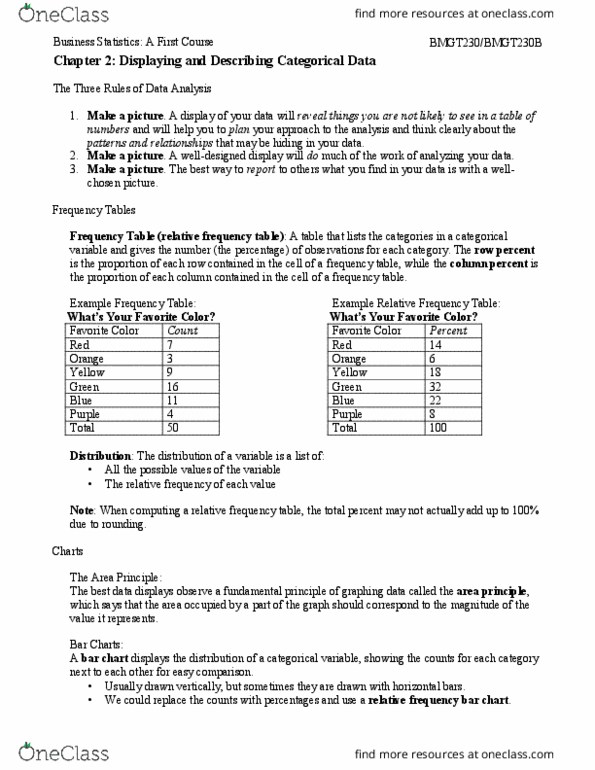
Comm291 - chapter 4 - displaying and describing categorical data. 4. 1 the three rules of data analysis: make a picture. To display your data will help you see things you may not see in a table of numbers and will help plan approach: make a picture, make a picture. A well designed display will do much of the work of analyzing your data and can show important features and patterns. Frequency table shows how a variable distributes its values. By organizing the counts, yo are effectively creating a frequent table. A variable that doesn"t have too many categories produces a frequency table that can be easy to read regardless of if there are 1000 s of cases. When you display percentages rather than counts, you have created a relative frequency table. This shows the distribution of categorical variables. Make sure that when you are creating a picture for your analysis, that there is a proportional and accurately represented picture.