PHL145H5 Chapter Notes - Chapter 15: Physical Attractiveness, Hasty Generalization, Confirmation Bias

Document Summary
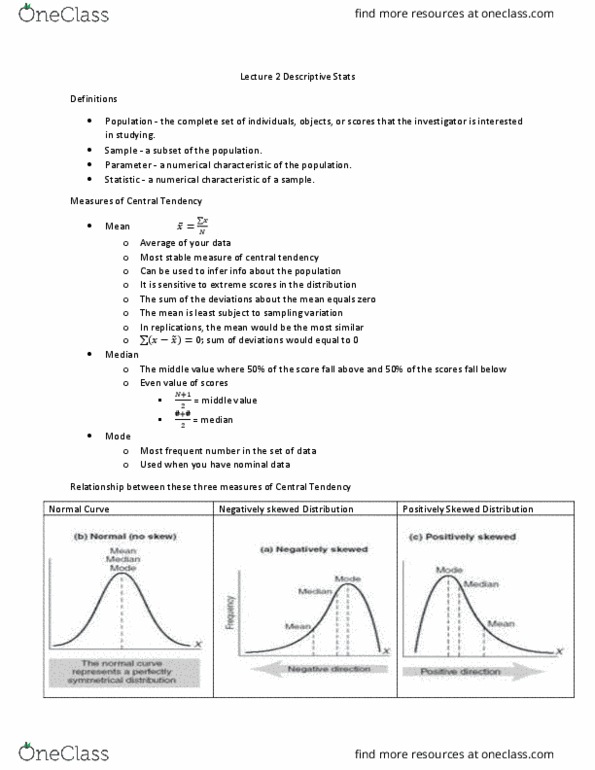
Population: group of things: sample: subgroup within the population. Eg/ all college graduates vs 1000 college graduates. Parameter: numerical characteristic of an entire population: gpa of all uft students. Statistic: numerical characteristic of an entire sample: gpa of 1000 uft students. Measures of tendency: mean: the average. Effected by extreme values: median: splits a group into halves and shows that a certain amount is greater or less than something aka the middle value, mode: most frequent value. Percentile rank: where you are compared to others. I got an 80% on the exam and 75% of the class got lower than be therefore i am at the 75th percentile. Quartiles: value of 1/4th of the distribution and the second quartile is the median. Standard deviation: average distance of the all the values from the mean. 7, 8, 8, 9 will have a lower sd than 1, 3, 6, 10. We use inferences all the time to draw conclusions.