ECO101H1 Chapter 3: Tut 2


Get access


Related textbook solutions


Related Documents
Related Questions
On an excel sheet answer the following questions:
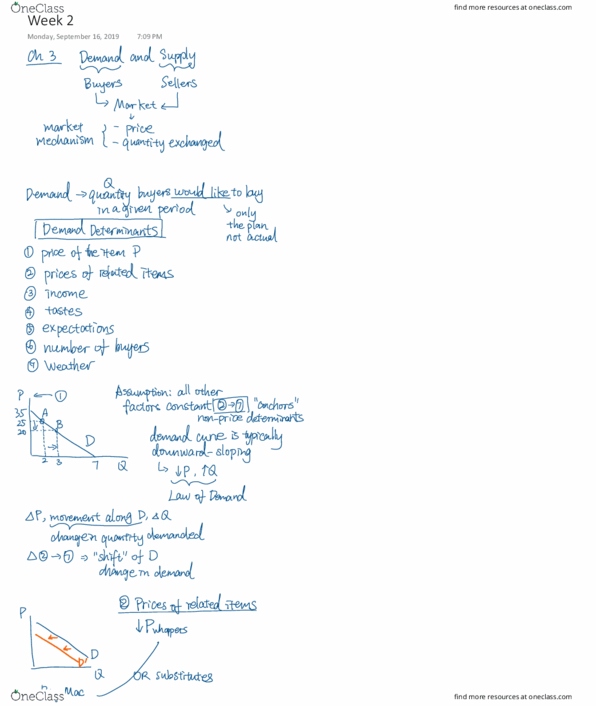
Q=Quantity (in 100s) of aspirin purchased in a year
P= Average price of aspirin in that year
Y=Annual income
A=Age of buyer
Q1. If we divide the population into two groups, up to age 35 and over age 35, which group purchases more aspirin?
Q2. Divide the population into three groups- up to age 30, over 30 and up to 45, and over 45. Do the purchases vary by age?
Q3. What is the relationship in a regression analysis between Q and P? Between Q and Y? Between Q and A?
| Observation | Q | P | Y | A |
| 1 | 1 | 1.5 | 20 | 25 |
| 2 | 2 | 1.5 | 40 | 20 |
| 3 | 4 | 1 | 12 | 25 |
| 4 | 2 | 1 | 10 | 30 |
| 5 | 2 | 1 | 8 | 30 |
| 6 | 3 | 2 | 30 | 35 |
| 7 | 3.5 | 1.5 | 30 | 40 |
| 8 | 4 | 2 | 20 | 40 |
| 9 | 7 | 1 | 20 | 45 |
| 10 | 1 | 3 | 15 | 40 |
| 11 | 2 | 2 | 18 | 30 |
| 12 | 3 | 2 | 20 | 32 |
| 13 | 3.5 | 2 | 15 | 36 |
| 14 | 4 | 2 | 10 | 30 |
| 15 | 2 | 3 | 25 | 20 |

Chapter 9
What is the profit-maximizing level of output and price?
What is the amount of total profit?
|
Quantity |
Price |
Total Revenue (dollars) |
Marginal revenue |
Total Cost |
Marginal cost |
|
1 |
22 |
6 |
6 |
||
|
2 |
20 |
14 |
8 |
||
|
3 |
18 |
26 |
12 |
||
|
4 |
16 |
44 |
18 |
||
|
5 |
14 |
72 |
28 |
||
|
6 |
12 |
112 |
40 |
||
|
7 |
10 |
166 |
54 |
||
|
8 |
8 |
236 |
70 |

Q7
Marginal cost is
| a. |
total revenue divided by the quantity of output. |
|
| b. |
total profit minus total costs. |
|
| c. |
the change in total cost brought about by selling an additional unit of the good. |
|
| d. |
the change in total revenue brought about by selling an additional unit of the good. |
|
| e. |
the change in total revenue minus the change in total costs. |
4 points
Q8
[Table 1] The dollar amounts that go in blanks (A) and (B) are, respectively,
Table-1
|
(1) |
(2) |
(3) |
|
|
Quantity Sold |
Marginal Revenue |
|
$10 |
10 |
|
|
$10 |
11 |
(A) |
|
$10 |
12 |
(B) |
|
$10 |
13 |
(C) |
|
$10 |
14 |
(D) |
| a. |
$11 and $11. |
|
| b. |
$10 and $10. |
|
| c. |
$10 and $11. |
|
| d. |
$11 and $12. |
4 points
Q9
[Table 1] The dollar amounts that go in blanks (C) and (D) are, respectively,
Table-1
|
(1) |
(2) |
(3) |
|
|
Quantity Sold |
Marginal Revenue |
|
$10 |
10 |
|
|
$10 |
11 |
(A) |
|
$10 |
12 |
(B) |
|
$10 |
13 |
(C) |
|
$10 |
14 |
(D) |
| a. |
$11 and $11. |
|
| b. |
$10 and $10. |
|
| c. |
$10 and $11. |
|
| d. |
$11 and $12. |
4 points
Q10
[Table 1] The demand curve facing the firm represented by the information in this table is
Table-1
|
(1) |
(2) |
(3) |
|
|
Quantity Sold |
Marginal Revenue |
|
$10 |
10 |
|
|
$10 |
11 |
(A) |
|
$10 |
12 |
(B) |
|
$10 |
13 |
(C) |
|
$10 |
14 |
(D) |
| a. |
downward-sloping. |
|
| b. |
upward-sloping. |
|
| c. |
horizontal. |
|
| d. |
vertical. |
4 points
Q11
[Table 2] The dollar amounts that go in blanks (E) is:
Table 2
|
-1 |
-2 |
-3 |
-4 |
-5 |
-6 |
-7 |
|
Quantity Sold |
Marginal Revenue |
Marginal |
Total |
Total |
Profit |
|
|
Price |
Cost |
Cost |
Revenue |
|||
|
$10 |
10 |
80 |
$100 |
$20 |
||
|
$10 |
11 |
(A) |
8 |
88 |
$110 |
$22 |
|
$10 |
12 |
(B) |
(E) |
97 |
(G) |
(I) |
|
$10 |
13 |
(C) |
(F) |
107 |
(H) |
(J) |
|
$10 |
14 |
(D) |
11 |
118 |
$140 |
$22 |
| a. |
$8 |
|
| b. |
$9 |
|
| c. |
$10 |
|
| d. |
$11 |
4 points
Q12
[Table 2] The dollar amounts that go in blanks (F) is:
Table 2
|
-1 |
-2 |
-3 |
-4 |
-5 |
-6 |
-7 |
|
Quantity Sold |
Marginal Revenue |
Marginal |
Total |
Total |
Profit |
|
|
Price |
Cost |
Cost |
Revenue |
|||
|
$10 |
10 |
80 |
$100 |
$20 |
||
|
$10 |
11 |
(A) |
8 |
88 |
$110 |
$22 |
|
$10 |
12 |
(B) |
(E) |
97 |
(G) |
(I) |
|
$10 |
13 |
(C) |
(F) |
107 |
(H) |
(J) |
|
$10 |
14 |
(D) |
11 |
118 |
$140 |
$22 |
| a. |
$8 |
|
| b. |
$9 |
|
| c. |
$10 |
|
| d. |
$11 |
