Statistical Sciences 1024A/B Chapter Notes - Chapter 16: Statistic, Scatter Plot, Confidence Interval

19 Sep 2018
School
Department
Professor
Document Summary
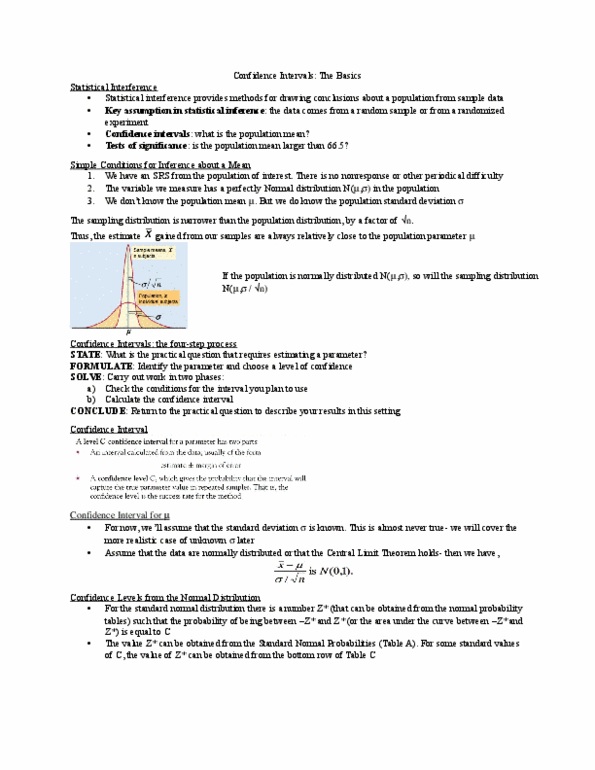
Statistical inference provides methods for drawing conclusions about a population from sample data. But we do know the population standard deviation . Sampling variability statistic usually differs from the population parameter. Because of knowledge of srs and sampling distributions we can predict the expected maximum size of the difference. Estimating the value of a parameter with a confidence interval. Assessing evidence for a claim about a parameter value using a test of significance. Both use: random samples, based on sampling distribution, use probabilities based on what would happened if we used the inferential procedure many times. Simple conditions for inference on , known (unrealistic) Data are from a perfect srs: however, most samples suffer bias, obtaining an entire population so we base inferences from samples that are reasonably close to an srs, do not use poorly collected to base inference on.