BIOL 1000 Chapter Notes - Chapter 1: Pressure Measurement, Pipette, Methylene Blue

13 Feb 2019
School
Department
Course
Professor
Document Summary
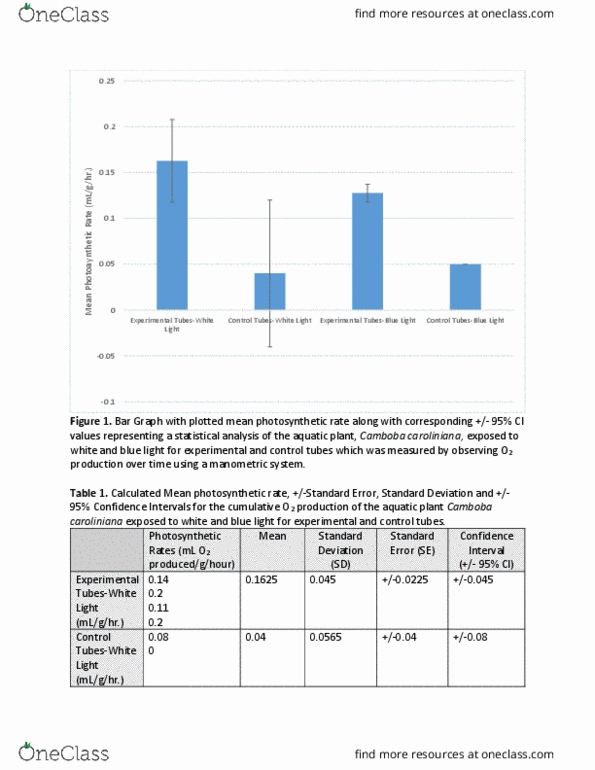
Table 1: photosynthetic rates and oxygen production data collected for the aquatic plant, Cabomba caroliniana, exposed to a white light source. The control test tubes are in absence of the aquatic species, cabomba caroliniana. The photosynthetic rate was calculated by the slope of the cumulative oxygen production and then divided by the corresponding plant weight with the unit ml o2 produced/g/hr. 0. 4 d e c u d o r p. Figure 1: the cumulative o2 production for the cabomba caroliniana was measured in a photosynthetic rate in ml o2 produced/g/hr. manometric apparatus over a time interval of 0. 27 hours (16 min). Photosynthetic rates and oxygen production data plotted for the aquatic plant, cabomba caroliniana, with the treatment level a white colored light. The lines of best fit for each test tube represents the corresponding. Table 2: the indicator for pipette readings, observed in the form of displacement, was the solution methylene blue.