MATH 1070 Chapter Notes - Chapter 4-5: Scatter Plot, Dependent And Independent Variables, Total Variation

Document Summary
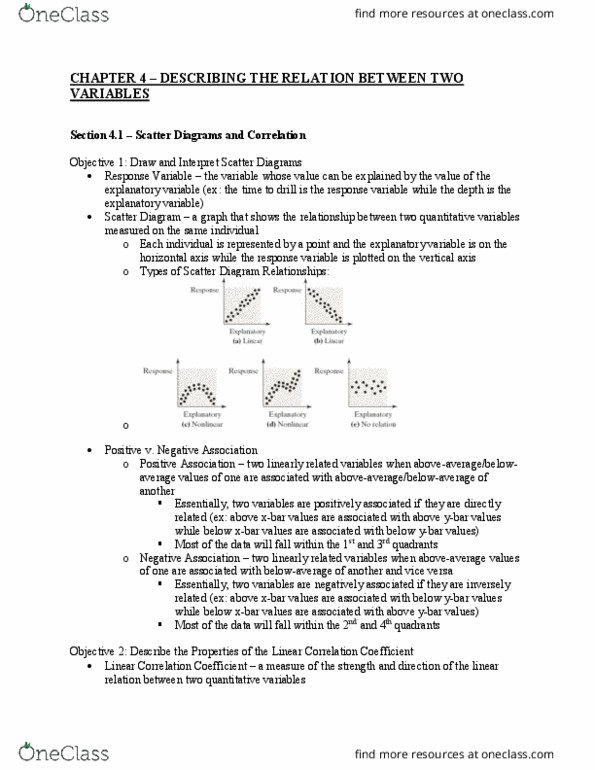
The response variable is the variable whose value can be explained by the value of the explanatory or predictor variable. A scatter diagram is a graph that shows the relationship between two quantitative variables measured on the same individual. Each individual in the data set is represented by a point in the scatter diagram. The explanatory variable is plotted on the horizontal axis, and the response variable is plotted on the vertical axis. Two variables that are linearly related are positively associated when above-average values of one variable are associated with above-average values of the other variable and below-average values of one variable are associated with below- average values of another variable. That is, two variables are positively associated if, whenever the value of one variable increases, the value of the other variable also increases. Two variables that are linearly related are negatively associated when above- average values of one variable are associated with below-average values of the other variable.