BAN 001 Chapter Notes - Chapter 4: Standard Deviation, Frequency Distribution, Poisson Distribution

7 Sep 2016
School
Department
Course
Professor
Document Summary
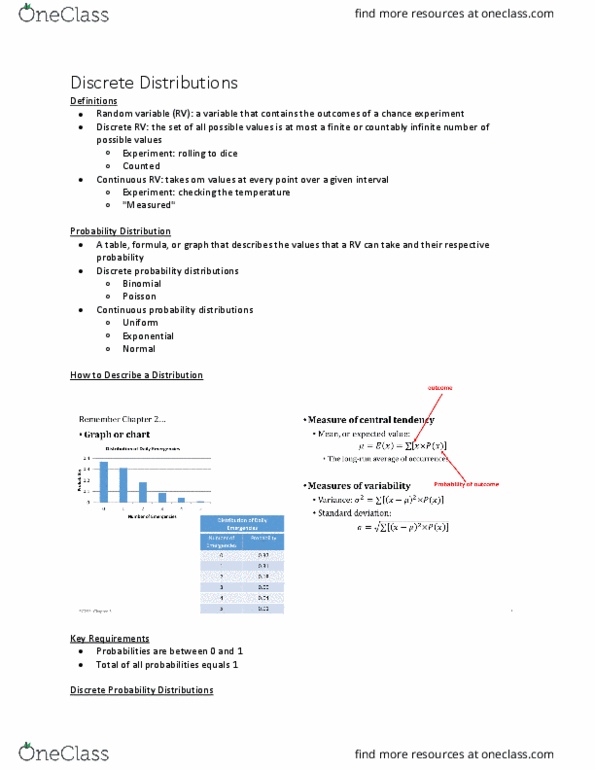
We have previously used a strategy of enumeration and basic probability rules to calculate probabilities of outcomes and events. However, as the number of possible outcomes increases it quickly becomes too tedious too enumerate all possible outcomes. For such cases, we look to see if the experiment that generates the outcomes has a definable structure. If it does, we can use known families of probability distributions to perform the analysis. These known families fit into two major classes discrete distributions and. When distributions fit no known form we must use empirical data to calculate probabilities, and the distributions" mean and variance. To calculate the mean and variance, we use a process known as expectation. Let"s illustrate the use of empirical data through the following problem. The management of cam electronics wants to do an analysis of sales of plasma tv sets over the last 100 sales days. They obtain the following data from sales records: