FINA 365 Chapter Notes - Chapter 1-7: Cash Flow, Retained Earnings

Get access


Related Documents
Related Questions
| Use the below information to answer the following question. |
| Income Statement | |
| For the Year | |
| Sales | $42,700 |
| Cost of goods sold | 29,250 |
| Depreciation | 3,750 |
| Earnings before interest and taxes | $ 9,700 |
| Interest paid | 1,360 |
| Taxable income | $ 8,340 |
| Taxes | 2,840 |
| Net income | $ 5,500 |
| Dividends $1,925 | |
| Balance Sheet | |
| End-of-Year | |
| Cash | $1,320 |
| Accounts receivable | 3,780 |
| Inventory | 10,200 |
| Total current assets | $15,300 |
| Net fixed assets | 33,600 |
| Total assets | $48,900 |
| Accounts payable | $ 3,650 |
| Long-term debt | 18,100 |
| Common stock ($1 par value) | 15,000 |
| Retained earnings | 12,150 |
| Total Liab. & Equity | $48,900 |
| The profit margin, the debt-equity ratio, and the dividend payout ratio for this firm are constant. Sales are expected to increase by $5,000 next year. What is the projected addition to retained earnings for next year? |

Question
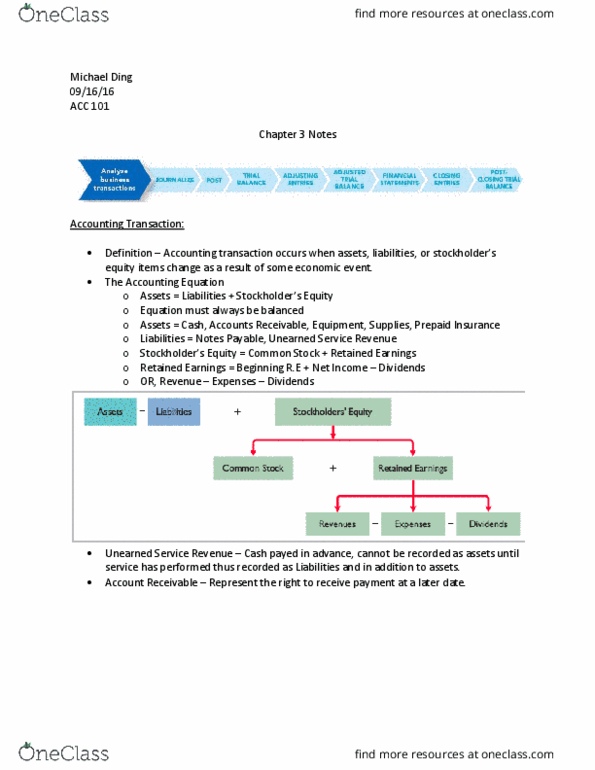
Analysis of Financial Statements
Balance Sheets
EXHIBITS: INPUT DATA (XYZ)
Table 1 Balance Sheets
| Assets | 2013E | 2012 | 2011 |
| cash | $ 85,632 | $7,282 | $57,600 |
| Acount Receivable | 878,000 | 632,160 | 351,200 |
| Inventories | 1,716,480 | 1,287,360 | 715,200 |
| Total current assets | $2,680,112 | $1,926,802 | $ 1,124,000 |
| Gross fixed assets | 1,197,160 | 1,202,950 | 491,000 |
| Less: accumulated depreciation | 380,120 | 263,160 | 146,200 |
| Net fixed assets | $ 817,040 | $ 939,790 | $ 344,800 |
| Total assets | $3,497,152 | $2,866,592 | $ 1,468,800 |
| Liabilities and equity | |||
| Accounts payable | $ 436,800 | $ 524,160 | $ 145,600 |
| Notes payable | 300,000 | 636,808 | 200,000 |
| Accruals | 408,000 | 489,600 | 136,000 |
| Total current liabilities | $1,144,800 | $1,650,568 | $ 481,600 |
| Long term bonds | 400,000 | 723,432 | 323,432 |
| Total debt | $1,544,800 | $2,374,000 | $ 805,032 |
| Common stock (100,000 shares) | 1,721,176 | 460,000 | 460,000 |
| Retained earnings | 231,176 | 32,592 | 203,768 |
| Total common equity | $1,952,352 | $ 492,592 | $ 663,768 |
| Total liabilities and equity | $3,497,152 | $2,866,592 | $ 1,468,800 |
Analysis of Financial Statements
Income Statements
Table 2
Income Statements
| 2013E | 2012 | 2011 | |
| Sales | $7,035,600 | $6,034,000 | $ 3,432,000 |
| Cost of goods sold | 5,875,992 | 5,528,000 | 2,864,000 |
| Other expenses | 550,000 | 519,988 | 358,672 |
| Total operating exp. excl. depreciation and amortization | $6,425,992 | $6,047,988 | $ 3,222,672 |
| EBITDA | $ 609,608 | $(13,988) | $ 209,328 |
| Depreciation and amortization | 116,960 | 116,960 | 18,900 |
| Earnings before interest and taxes (EBIT) | $492,648 | $(130,948) | $190,428 |
| Interest expense | 70,008 | 136,012 | 43,828 |
| Earnings before taxes (EBT) | $ 422,640 | $ (266,960) | $ 146,600 |
| Taxes (40%) | 169,056 | (106,784) | 58,640 |
| Net Income | $ 253,584 | $ (160,176) | $ 87,960 |
| Earnings per share (EPS) | $ 1.014 | $ (1.602) | $ 0.880 |
| Dividends per share (DPS) | $ 0.220 | $ 0.110 | $ 0.220 |
| Book value per share (BVPS) | $ 7.809 | $ 4.926 | $ 6.638 |
| Stock price | $ 12.17 | $ 2.25 | $ 8.50 |
| Shares outstanding | 250,000 | 100,000 | 100,000 |
| Tax rate | 40.00% | 40.00% | 40.00% |
| Lease payments | $ 40,000 | $ 40,000 | $ 40,000 |
| Sinking fund payments | 0 | 0 | 0 |
Analysis of Financial Statements
Ratio Analysis
| 2013E | 2012 | 2011 | Industry Average | |
| Current ratio | * | 1.2 | 2.3 | 2.7 |
| Quick ratio | * | 0.4 | 0.8 | 1.0 |
| Inventory turnover | * | 4.7 | 4.8 | 6.1 |
| Days sales outstanding (DSO) | * | 38.2 | 37.4 | 32.0 |
| Fixed assets turnover | * | 6.4 | 10.0 | 7.0 |
| Total assets turnover | * | 2.1 | 2.3 | 2.6 |
| Debt-to- assets ratio | * | 82.8% | 54.8% | 50.0% |
| Times interest earned (TIE) | * | -1.0 | 4.3 | 6.2 |
| Operating margin | * | -2.2% | 5.6% | 7.3% |
| Profit margin | * | -2.7% | 2.6% | 3.5% |
| Basic earning power (BEP) | * | -4.6% | 13.0% | 19.1% |
| Return on assets(ROA) | * | -5.6% | 6.0% | 9.1% |
| Return on equity (ROE) | * | -32.5% | 13.3% | 18.2% |
| Price/earnings (P/E) | * | -1.4 | 9.7 | 14.2 |
| Market/book (M/B) | * | 0.5 | 1.3 | 2.4 |
| Book value per share (BVPS) | * | $4.93 | $6.64 | n.a. |
Requiremnts:
Note: Question 1 through 5 has been answered completley, thank you very much. Please I am waiting for the question 6 and 7.
6. Use the extended DuPont equation to provide a summary and overview of XYZâs financial condition as projected for 2013.
7. Use the following simplified 2013 balance sheet to show, in general terms, how an improvement in the DSO would tend to affect the stock price. For example, if the company could improve its collection procedures and thereby lower its DSO from 45.6 days to the 32-day industry average without affecting sales, how would that change âripple throughâ the financial statements (shown in thousands below) and influence the stock price?
Accounts receivable $878 Debt $1,545
Other current assets 1,802
Net fixed assets 817 Equity 1,952
Total assets $3,497 Liabilities plus equity $3,497
First, we need to calculate XYZâs daily sales.
Daily sales = Sales / 365
Daily sales = $7,035,600 / 365
Daily sales = $19,275.62
Target A/R = Daily sales à Target DSO
Target A/R = $19,276 Ã 32
Target A/R = $616,820
Freed-up cash = old A/R â new A/R
Freed-up cash = $878,000 â $616,820
Freed-up cash = $261,180
Some recent financial statements for Smolira Golf, Inc.,follow.
| SMOLIRA GOLF, INC. Balance Sheets as of December 31, 2015 and 2016 | ||||||||||||||||
| 2015 | 2016 | 2015 | 2016 | |||||||||||||
| Assets | Liabilities and Ownersâ Equity | |||||||||||||||
| Current assets | Current liabilities | |||||||||||||||
| Cash | $ | 3,181 | $ | 3,257 | Accounts payable | $ | 2,158 | $ | 2,610 | |||||||
| Accounts receivable | 4,762 | 5,771 | Notes payable | 1,755 | 2,126 | |||||||||||
| Inventory | 12,498 | 13,772 | Other | 91 | 108 | |||||||||||
| Total | $ | 20,441 | $ | 22,800 | Total | $ | 4,004 | $ | 4,844 | |||||||
| Long-term debt | $ | 13,300 | $ | 16,060 | ||||||||||||
| Ownersâ equity | ||||||||||||||||
| Common stock and paid-in surplus | $ | 38,500 | $ | 38,500 | ||||||||||||
| Fixed assets | Accumulated retained earnings | 15,659 | 39,185 | |||||||||||||
| Net plant and equipment | $ | 51,022 | $ | 75,789 | Total | $ | 54,159 | $ | 77,685 | |||||||
| Total assets | $ | 71,463 | $ | 98,589 | Total liabilities and ownersâ equity | $ | 71,463 | $ | 98,589 | |||||||
| SMOLIRA GOLF, INC. 2016 Income Statement | |||||
| Sales | $ | 187,570 | |||
| Cost of goods sold | 126,303 | ||||
| Depreciation | 5,323 | ||||
| EBIT | $ | 55,944 | |||
| Interest paid | 1,420 | ||||
| Taxable income | $ | 54,524 | |||
| Taxes | 19,083 | ||||
| Net income | $ | 35,441 | |||
| Dividends | $ | 11,915 | |||
| Retained earnings | 23,526 | ||||
Smolira Golf has 11,000 shares of common stock outstanding, andthe market price for a share of stock at the end of 2016 was$78.
What is the priceâearnings ratio? (Do not roundintermediate calculations and round your answer to 2 decimalplaces, e.g., 32.16.)
Priceâearnings ratio times
What is the priceâsales ratio? (Do not round intermediatecalculations and round your answer to 2 decimal places, e.g.,32.16.)
Priceâsales ratio times
What are the dividends per share? (Do not roundintermediate calculations and round your answer to 2 decimalplaces, e.g., 32.16.)
Dividends per share $
What is the market-to-book ratio at the end of 2016? (Donot round intermediate calculations and round your answer to 2decimal places, e.g., 32.16.)
Market-to-book ratio times
