PSY-0031 Chapter Notes - Chapter 3: Level Of Measurement, Histogram, Percentile Rank

24 Jan 2017
School
Department
Course
Professor
Document Summary
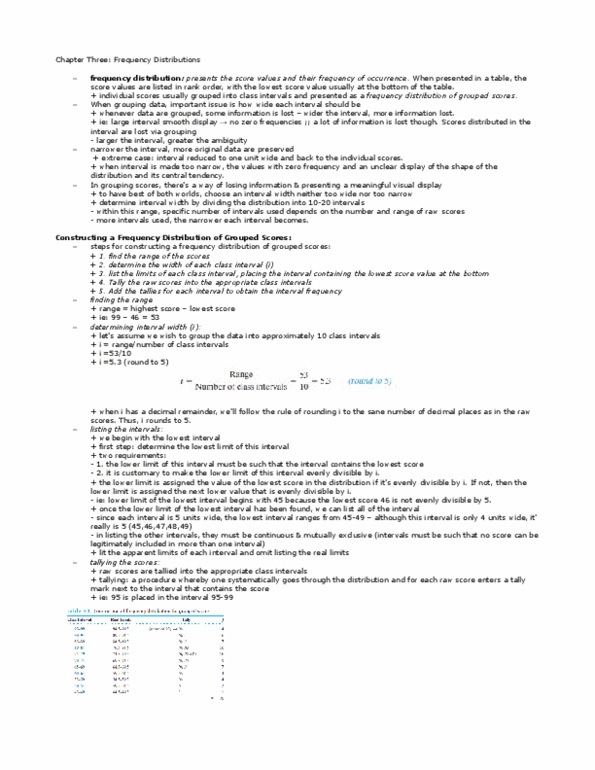
Frequency distribution - presents the score values and their frequency of occurrence. In a table, the scores are presented in rank order with the lowest score at the bottom. This table presents the entire range of scores, even if some of the scores were not received. Listing individual scores, some with a frequency of zero, makes it hard to visualize the share of the distribution. Grouped into class intervals and presented as a frequency distribution of grouped scores. When data are grouped, some information is lost. The wider the interval, the more information lost. When the interval is too narrow, you can have intervals with zero frequency. There is tradeoff between losing information and presenting a meaningful visual display. Typically, we divide the distribution into 10-20 intervals. Relative frequency distribution - indicates the proportion of the total number of scores that occurs in each interval.