STATS 13 Chapter 6: Assigned Reading Ch 6

Document Summary
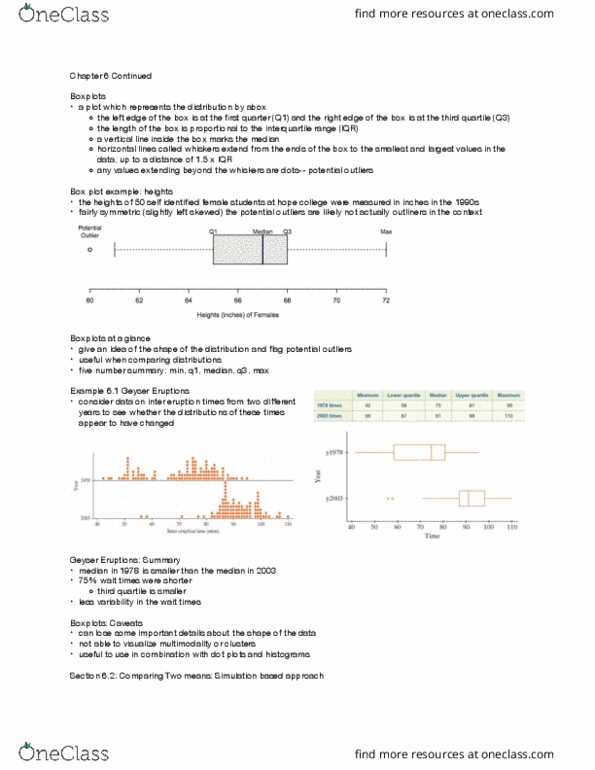
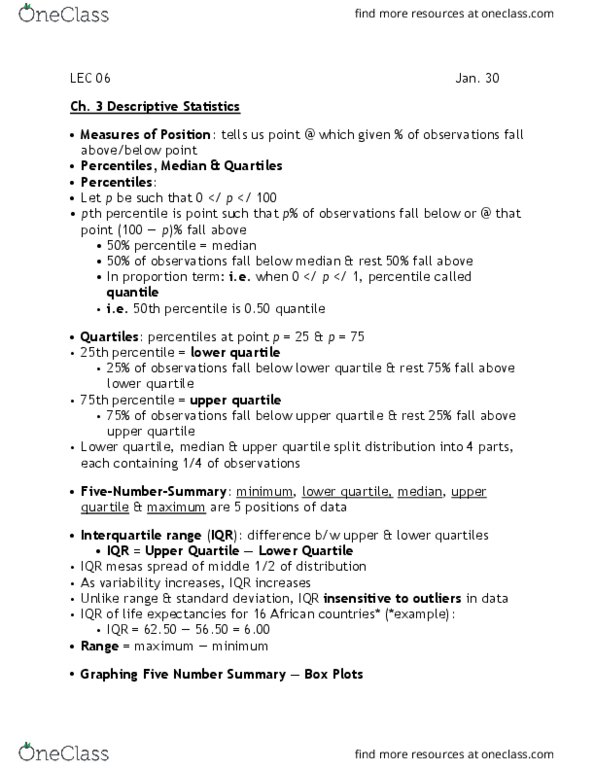
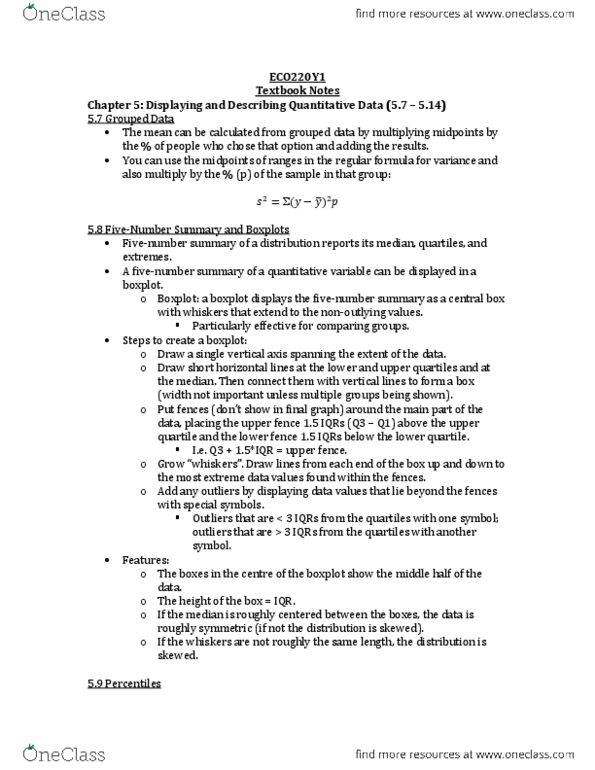
Lower quartile (25th percentile): the value for which 25% of the data lie below that value. Upper quartile (75th percentile): the value for which 25% of the data lie above that value. Quartiles can be calculated by determining the median of the values above/below the location of the overall median. Five number summary: includes the minimum, lower quartile, median, upper quartile, and maximum for the distribution of a quantitative variable. Median and iqr are not sensitive to extreme values (resistant) Standard deviation is sensitive to extreme values and skewness. Boxplot: visual display of the five number summary. Box displays the middle 50% of the distribution and its width (iqr) Whiskers extend to the smallest and largest values in the data set. 3s strategy can be used to assess whether two sample means differ enough to conclude that there is a genuine difference in population means or long run means. Null hypothesis is expressed as no association between two variables.