PSYC 60 Chapter Notes - Chapter 2: Normal Distribution, Abscissa And Ordinate, Level Of Measurement

Document Summary
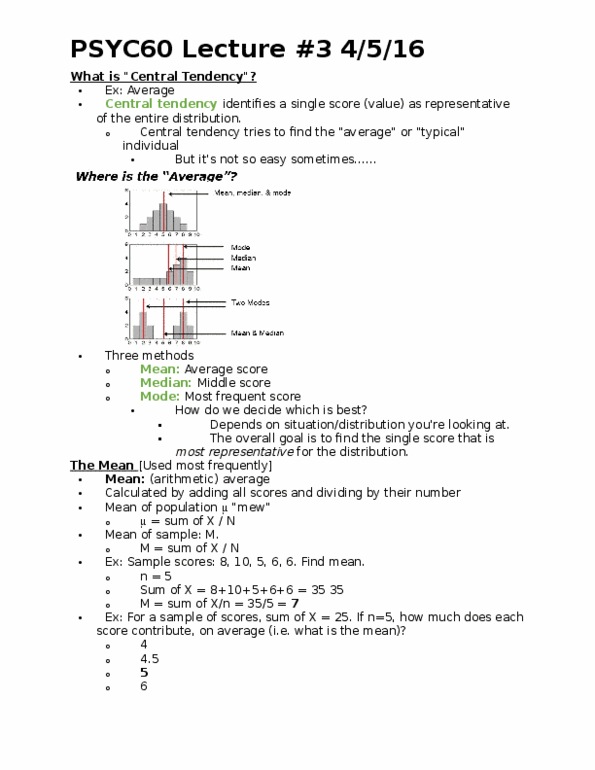
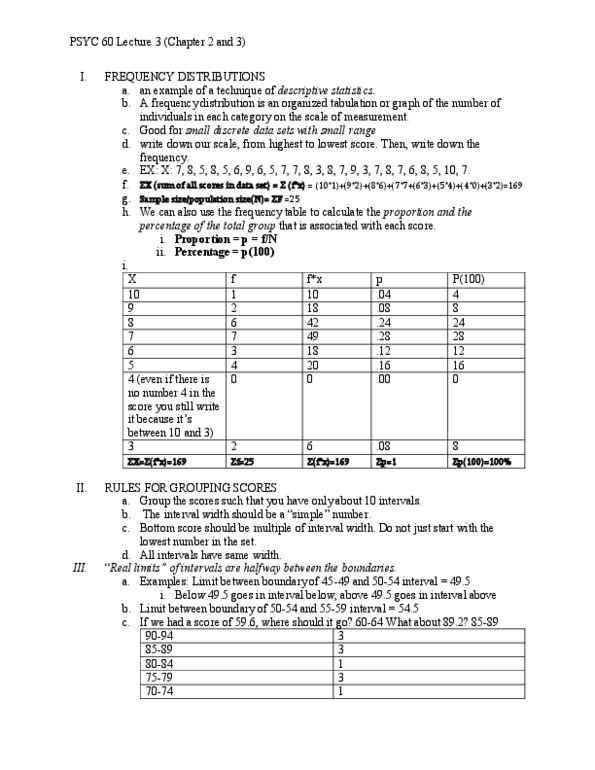
2-2a obtaining x from a frequency distribution table: multiply each x value by its frequency and add these products ( fx) to find the total number of scores. 2-2b proportions and percentages: proportion: measures the fraction of the total group that is associated with each score (proportion=p=f/n) Often called relative frequencies; usually appear as decimals: percentages: find proportion (p) and multiply by 100 to find the percentage. 2-2c grouped frequency distribution tables: unreasonable to list all individuals scored for a large range of values, group scored into intervals and list intervals in a table. If you are measuring a continuous variable, the real limits are slightly larger in magnitude than the apparent limits (39. 5-49. 5) There are still no gaps in the scale. 2-3 frequency distribution graphs: a picture of the information available in a frequency distribution table, x-axis (abscissa) lists the set of x values, y-axis (ordinate) lists the frequencies of the x values.